
The Elite tier is the Ryzen 7 9850X3D, fastest in games, then the 9800X3D and 9950X3D; all seven chips scoring above 80 are AMD X3D parts. Intel’s best is the Core i9-14900K at 78.2. I tier 30 processors by Tom’s Hardware’s August 26, 2026 1080p gaming score: Elite 90+, Excellent 80+, Strong 73+, Solid 67+, Entry below 67.
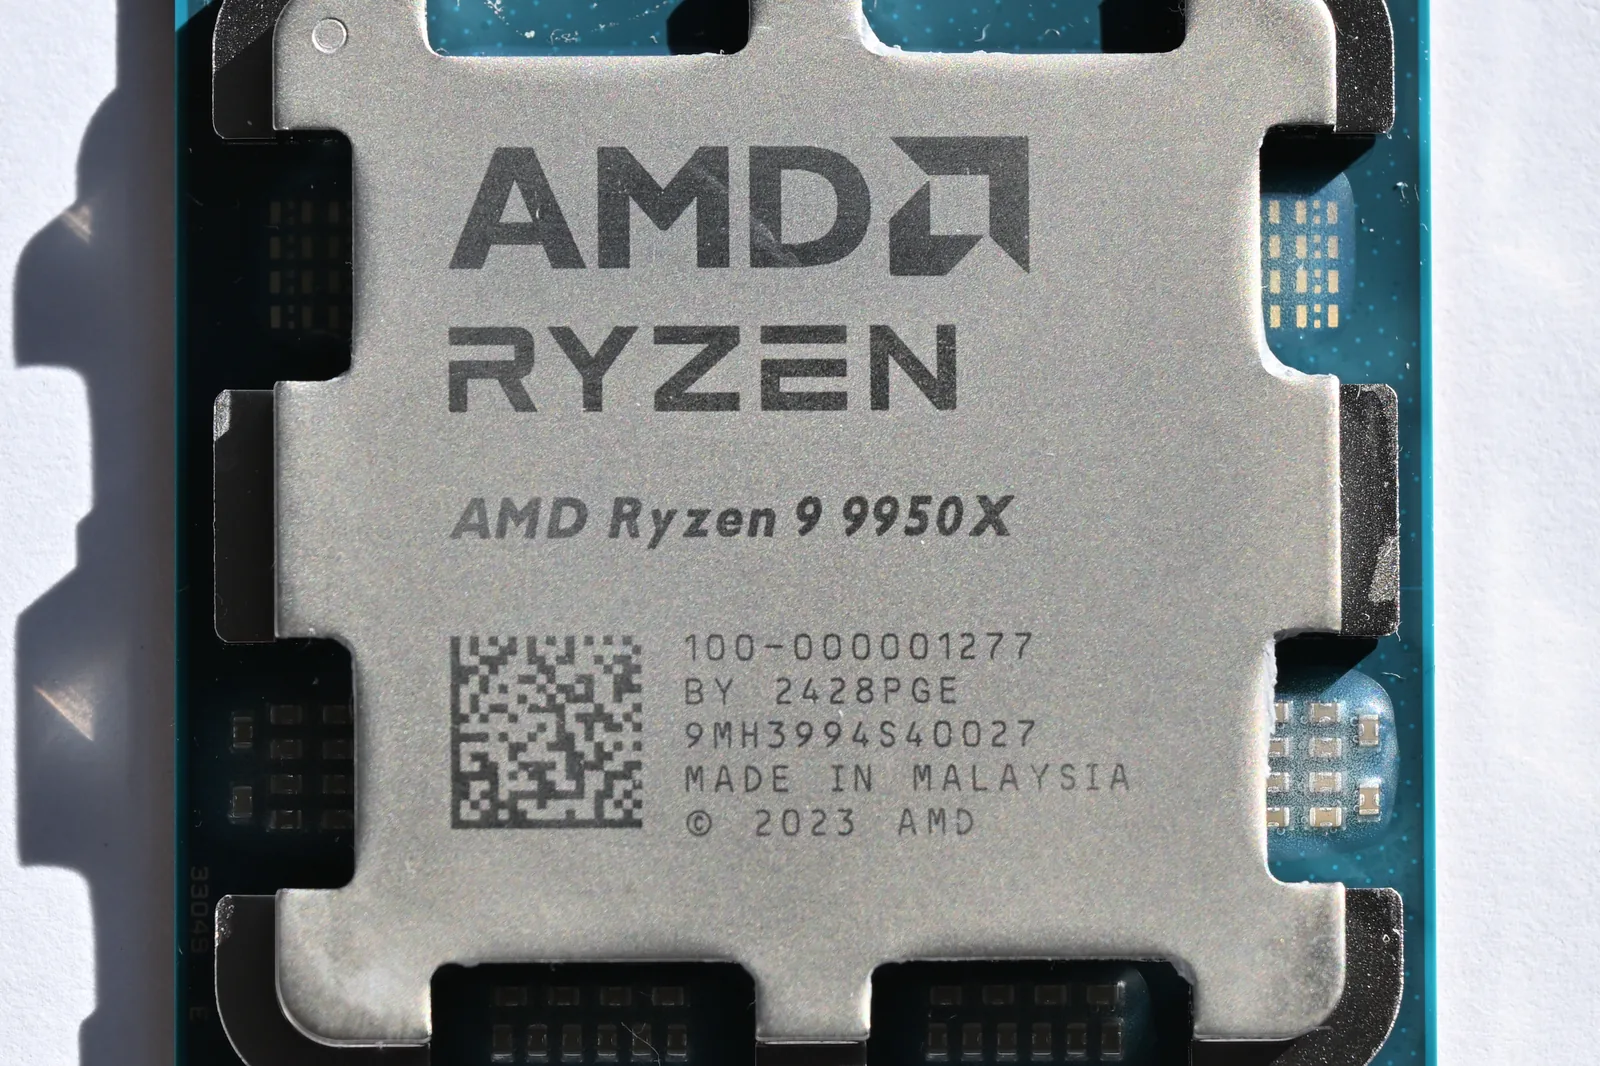
The Ryzen 7 9850X3D is 2026’s fastest gaming CPU. AMD’s Ryzen 7 9800X3D (97.0) and Ryzen 9 9950X3D (95.7) sit just behind it; those three are the Elite tier, and all seven chips that score above 80 are AMD X3D parts. Intel’s fastest is the Core i9-14900K at 78.2, with the Core Ultra 7 270K Plus at 77.5. The table below ranks 30 processors by 1080p gaming score from the Tom’s Hardware CPU benchmark hierarchy as updated August 26, 2026, with the 9850X3D at 100. I put each chip in one of five tiers: Elite 90 and up, Excellent 80 to 89.9, Strong 73 to 79.9, Solid 67 to 72.9 and Entry below 67.
Gaming CPUs barely spread out: the GPU hierarchy’s 1440p scores run from 25 to 100, but every processor here scores 58 or better. The slowest chip on the list still games well, and the gap between a mid-tier and a top-tier part can exceed 20 points at 1080p and shrinks at 1440p and 4K, where the graphics card sets the frame rate.
Why the top is all cache
Games are latency-bound in a way that most productivity work is not. They fire off enormous numbers of small, unpredictable memory requests, and every one that misses the cache means a long wait on system RAM. AMD’s 3D V-Cache adds a 64MB slab of L3 cache to a compute die, so an eight-core X3D chip like the 9800X3D carries 96MB of L3 against 32MB on the 9700X, and far more of those requests are answered at once. On the Ryzen 9000X3D chips the cache die sits beneath the cores; on the 7000X3D chips it sits on top of them. The payoff is largest in the games that hammer the CPU: simulation and strategy titles, and esports played at high refresh.
That inverts the usual “more cores, more money, more performance” instinct. A cache-heavy chip with fewer cores routinely beats a higher-clocked, higher-core, more expensive processor, and draws less power doing it. Count cache before cores.
6 cores · 3D V-Cache
24 cores · no 3D V-Cache
8 cores · 3D V-Cache
16 cores · no 3D V-Cache
This is a gaming ranking. Those extra cores on a 9950X or a 14900K are not wasted; they win in rendering and compiling, and in anything else that scales with threads. If you do serious multi-core work as well as game, read the Strong tier below with that in mind. If the machine exists to play games, the list starts and ends with cache.
The 2026 CPU gaming hierarchy
| # | Processor | Gaming index | Tier |
|---|---|---|---|
| 1 | Ryzen 7 9850X3D | 100.0 | Elite |
| 2 | Ryzen 7 9800X3D | 97.0 | Elite |
| 3 | Ryzen 9 9950X3D | 95.7 | Elite |
| 4 | Ryzen 9 9900X3D | 86.9 | Excellent |
| 5 | Ryzen 7 7800X3D | 85.6 | Excellent |
| 6 | Ryzen 9 7950X3D | 83.9 | Excellent |
| 7 | Ryzen 5 7600X3D | 80.6 | Excellent |
| 8 | Core i9-14900K | 78.2 | Strong |
| 9 | Core Ultra 7 270K Plus | 77.5 | Strong |
| 10 | Ryzen 9 7900X3D | 77.1 | Strong |
| 11 | Ryzen 9 9950X | 76.9 | Strong |
| 12 | Core i9-13900K | 76.8 | Strong |
| 13 | Core i7-14700K | 76.4 | Strong |
| 14 | Core i7-13700K | 75.8 | Strong |
| 15 | Ryzen 9 9900X | 73.9 | Strong |
| 16 | Core Ultra 5 250K Plus | 73.3 | Strong |
| 17 | Core i5-14600K | 72.8 | Solid |
| 18 | Ryzen 5 9600X | 72.6 | Solid |
| 19 | Core Ultra 9 285K | 71.8 | Solid |
| 20 | Ryzen 9 7950X | 71.0 | Solid |
| 21 | Core i5-13600K | 70.9 | Solid |
| 22 | Ryzen 7 7700X | 70.6 | Solid |
| 23 | Core Ultra 7 265K | 70.3 | Solid |
| 24 | Ryzen 9 7900X | 69.2 | Solid |
| 25 | Ryzen 5 7600X | 67.3 | Solid |
| 26 | Core Ultra 5 245K | 67.1 | Solid |
| 27 | Core i7-12700K | 65.8 | Entry |
| 28 | Core Ultra 5 225 | 62.5 | Entry |
| 29 | Core i5-12600K | 60.8 | Entry |
| 30 | Core i5-14400 | 58.0 | Entry |
Scores are Tom’s Hardware’s 1080p gaming results (an RTX 5090 Founders Edition at a mix of High and Ultra settings, geometric mean of 17 games), normalized so the Ryzen 7 9850X3D is 100, from the Tom’s Hardware CPU benchmark hierarchy as updated August 26, 2026. The Ryzen 9 9950X3D2 is not ranked. Tom’s gaming table has no score for it yet.
How to use the tiers
Elite (3 chips, 90 or higher). The fastest gaming processors, all AMD X3D. Worth it for high-refresh 1080p and 1440p competitive play, or if you want the best and will keep the platform a long time. For 4K-focused gaming the premium is hard to feel.
Excellent (4 chips, 80 to 89.9). All four are X3D cache parts. They sit within 20 points of the top. For most gaming builds this tier is the sensible ceiling.
Strong (9 chips, 73 to 79.9). High-end Intel Core and Ryzen chips, including the 7900X3D. They game very well and pull ahead in multi-core work, so this tier suits people who do real work outside games as well as play them. Intel’s Arrow Lake Refresh lands here: the Core Ultra 7 270K Plus and Core Ultra 5 250K Plus add four E-cores over the 265K and 245K, and Intel’s Binary Optimization Tool (iBOT) lifted average frame rates about 8% on both chips across the games it supports in Tom’s Hardware’s March 26, 2026 test. The 270K Plus still finishes 22.5 points behind the 9850X3D and 8.1 behind the 7800X3D. For a pure gaming build, X3D leads. The 270K Plus tops Tom’s single-threaded table. Consider it for apps that depend on single-thread speed.
Solid (10 chips, 67 to 72.9). This is the value middle. These chips run any game well and pair naturally with a mid-range graphics card; at 1440p and 4K you would struggle to tell them from the tiers above.
Entry (4 chips, below 67). Alder Lake’s Core i7-12700K and i5-12600K, plus two 65W chips, the Core Ultra 5 225 and the Core i5-14400. They still game capably at 1080p. They suit a budget build, especially beside a graphics card that sets the limit at your resolution.
Pick the right CPU for your build
A hierarchy shows gaming speed, but the right chip depends on your resolution, your graphics card, and whether you do multi-core work. To compare any two processors head-to-head, use the CPU Comparison Tool. To check whether a CPU will bottleneck a specific graphics card at your resolution, use the PC Bottleneck Calculator. And for where graphics cards land, see the GPU Hierarchy 2026; for storage, the SSD tier list tiers current NVMe drives by PCIe generation, NAND type and cache. For specific X3D matchups, put the budget Ryzen 5 7600X3D against the 7800X3D in the comparison tool, read the flagship Ryzen 9 9950X3D vs 9800X3D, or weigh a 7800X3D to 9800X3D upgrade. For hands-on takes, our Ryzen 7 7800X3D review covers the Excellent-tier value benchmark, and the 9800X3D undervolt guide shows how to run the Elite-tier chip cooler and more efficiently with Curve Optimizer.
Frequently asked questions
How is this CPU hierarchy ranked?
Why are the gaming scores so close together?
Why do AMD X3D chips top the list?
Does a higher-tier CPU mean higher frame rates for me?
How current is this data?
Sources and corrections
- Last updated
- Methodology
- See our methodology for research and review standards.
- Update log
- 2026-09-23 — Page updated.
- Corrections
- Spotted an error or a stale number? Email contact@techfuelhq.com. Confirmed corrections are added to the update log above.