
S tier is the RTX 5090, RTX 4090, RTX 5080, RX 7900 XTX, RTX 4080 Super, RTX 4080, RTX 5070 Ti and RX 9070 XT. A starts at the RX 7900 XT, B at the RX 9070 GRE, C at the RX 9060 XT 8GB, D at the RTX 4060. I tier 43 desktop cards by 1440p raster speed.
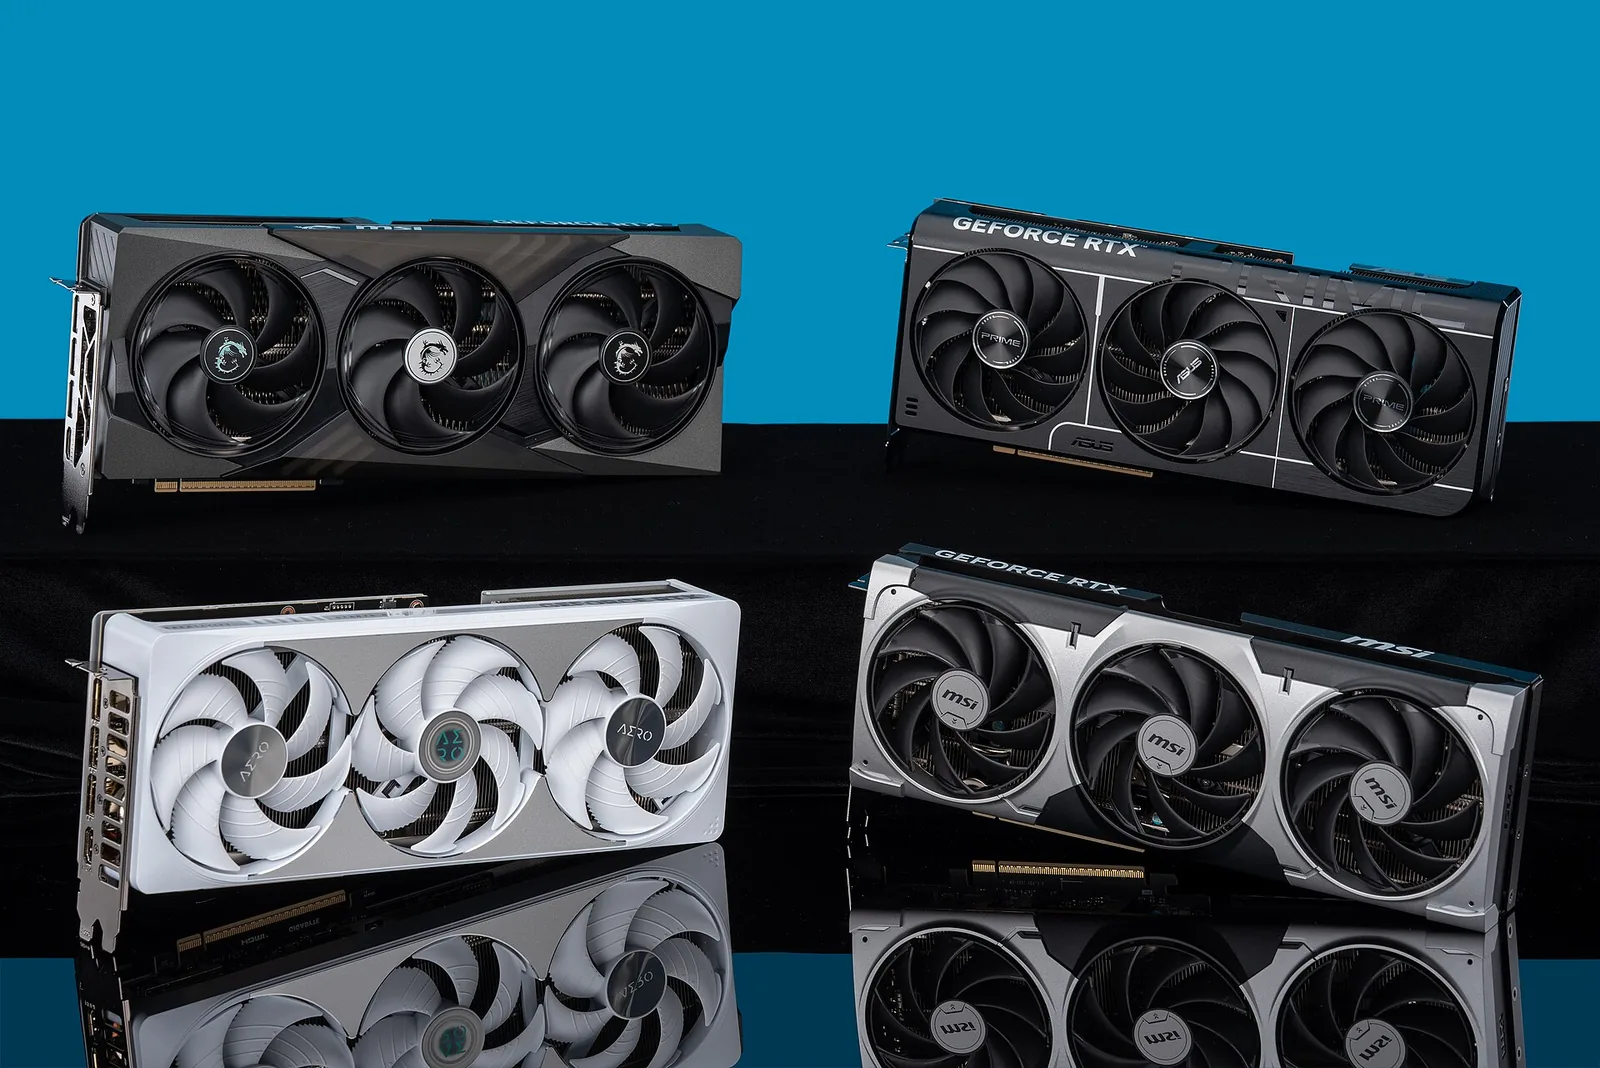
I tier 43 desktop graphics cards by 1440p speed. The score is Tom’s Hardware’s native 1440p Ultra raster result with the fastest card set to 100, and the letters are my cutoffs: S from 69, A from 53, B from 40, C from 30, D below that.
| Tier | 1440p score | Cards, fastest first |
|---|---|---|
| S | 69.7 to 100 | RTX 5090, RTX 4090, RTX 5080, RX 7900 XTX, RTX 4080 Super, RTX 4080, RTX 5070 Ti, RX 9070 XT |
| A | 53.3 to 64.6 | RX 7900 XT, RTX 4070 Ti Super, RX 9070, RTX 3090 Ti, RTX 4070 Ti, RTX 5070, RTX 3090, RTX 4070 Super, RX 6950 XT, RTX 3080 Ti |
| B | 40.0 to 51.8 | RX 9070 GRE, RX 7800 XT, RX 6900 XT, RTX 3080 10GB, RX 6800 XT, RTX 4070, RTX 5060 Ti 16GB, RX 7700 XT, RTX 5060 Ti 8GB, RX 9060 XT 16GB, RTX 3070 Ti |
| C | 30.3 to 37.3 | RX 9060 XT 8GB, RTX 4060 Ti 16GB, RTX 5060, RTX 4060 Ti 8GB, RTX 3070, RX 6750 XT, RX 6700 XT, RTX 3060 Ti, Arc B580 |
| D | 25.0 to 28.4 | RTX 4060, RX 7600, RTX 5050, Arc B570, RTX 3060 12GB |
For a new card, I start with the RTX 5060 Ti 16GB or RX 9060 XT 16GB for 1440p, and the RTX 5070 Ti or RX 9070 XT for 4K.
Here is what S tier means in frames. My ASUS ROG Astral RTX 5080 OC runs Cyberpunk 2077 at native 4K Ultra, without ray tracing or upscaling, at 58 FPS average and 49 FPS 1% lows. That run is in my first-party Astral dataset.
The ranking’s raster scores come from Tom’s Hardware’s June 24, 2026 GPU hierarchy, re-checked September 22, 2026. Retention and the tiers are my arithmetic on those scores.
Jump to the ranking, older cards and upgrades, the 8GB problem, NVIDIA, AMD, or Intel Arc.
Which tier for 1080p, 1440p or 4K?
If you already own a card, try your games at the settings you plan to keep before trusting any tier label.
| Resolution | My starting tier | Cards I would compare first | What would change my choice |
|---|---|---|---|
| 1080p | C; D with more settings flexibility | Arc B580, RTX 5060, RX 9060 XT 8GB | I check demanding textures and CPU limits before chasing a higher tier. |
| 1440p | B; A for more headroom | RX 9060 XT 16GB, RTX 5060 Ti 16GB; then RX 9070 or RTX 5070 | I favor the higher-memory variants, then check actual game frame rates; the RTX 5060 Ti 1440p build is the worked example. |
| 4K | S; A with settings compromises | RX 9070 XT, RTX 5070 Ti; then RTX 5080 or RX 7900 XTX | I use the 4K column and game-specific tests, especially if ray tracing is essential; my 4K GPU guide walks the shortlist. |
For competitive play at low settings, check the processor before moving up this ladder; my CPU hierarchy compares processors and the PC bottleneck calculator is a rough pairing screen, but I only call a CPU limit confirmed after measuring the game itself on the PC in question.
GPU hierarchy: rank and retention
Retention = 4K score / 1080p score × 100. It tracks a card’s standing against the leader as resolution rises. Higher means the card holds its place better. It does not mean the card is faster.
Inside a band the scores still differ. The RTX 5090 and RX 9070 XT share S and sit 30.3 points apart at 1440p. Equal displayed scores share a rank.
† marks an 8GB card with retention below 60%. Before buying one of those for a 1440p or 4K monitor, read the memory-variant pairs under the table. On a narrow screen, scroll the table sideways to see retention.
| Rank | GPU | Tier | 1080p | 1440p | 4K | VRAM | Retention |
|---|---|---|---|---|---|---|---|
| 1 | GeForce RTX 5090 | S | 100.0 | 100.0 | 100.0 | 32GB | 100.0% |
| 2 | GeForce RTX 4090 | S | 90.1 | 85.7 | 80.4 | 24GB | 89.2% |
| 3 | GeForce RTX 5080 My Astral: 32,350 Time Spy Graphics, Stock | S | 81.9 | 76.7 | 69.8 | 16GB | 85.2% |
| 4 | Radeon RX 7900 XTX | S | 79.3 | 73.1 | 63.7 | 24GB | 80.3% |
| 5 | GeForce RTX 4080 Super | S | 78.0 | 70.9 | 62.6 | 16GB | 80.3% |
| 6 | GeForce RTX 4080 | S | 77.2 | 70.3 | 60.9 | 16GB | 78.9% |
| 7 | GeForce RTX 5070 Ti | S | 76.2 | 69.8 | 61.9 | 16GB | 81.2% |
| 8 | Radeon RX 9070 XT | S | 76.9 | 69.7 | 59.4 | 16GB | 77.2% |
| 9 | Radeon RX 7900 XT | A | 71.3 | 64.6 | 54.0 | 20GB | 75.7% |
| 10 | GeForce RTX 4070 Ti Super | A | 69.3 | 62.1 | 52.8 | 16GB | 76.2% |
| 10 | Radeon RX 9070 | A | 69.1 | 62.1 | 52.1 | 16GB | 75.4% |
| 12 | GeForce RTX 3090 Ti | A | 64.7 | 59.7 | 53.5 | 24GB | 82.7% |
| 13 | GeForce RTX 4070 Ti | A | 66.3 | 58.6 | 48.6 | 12GB | 73.3% |
| 14 | GeForce RTX 5070 | A | 65.1 | 57.6 | 49.0 | 12GB | 75.3% |
| 15 | GeForce RTX 3090 | A | 60.3 | 54.7 | 47.9 | 24GB | 79.4% |
| 16 | GeForce RTX 4070 Super | A | 62.2 | 54.5 | 44.4 | 12GB | 71.4% |
| 17 | Radeon RX 6950 XT | A | 60.5 | 53.5 | 43.6 | 16GB | 72.1% |
| 18 | GeForce RTX 3080 Ti | A | 58.7 | 53.3 | 46.0 | 12GB | 78.4% |
| 19 | Radeon RX 9070 GRE | B | 59.2 | 51.8 | 41.8 | 12GB | 70.6% |
| 20 | Radeon RX 7800 XT | B | 58.1 | 50.7 | 40.7 | 16GB | 70.1% |
| 21 | Radeon RX 6900 XT | B | 57.4 | 50.2 | 40.5 | 16GB | 70.6% |
| 22 | GeForce RTX 3080 (10GB) | B | 54.8 | 49.0 | 39.6 | 10GB | 72.3% |
| 23 | Radeon RX 6800 XT | B | 54.9 | 47.6 | 38.1 | 16GB | 69.4% |
| 24 | GeForce RTX 4070 | B | 54.7 | 46.5 | 37.2 | 12GB | 68.0% |
| 25 | GeForce RTX 5060 Ti 16GB | B | 51.6 | 43.9 | 36.3 | 16GB | 70.3% |
| 26 | Radeon RX 7700 XT | B | 50.5 | 43.4 | 34.3 | 12GB | 67.9% |
| 27 | GeForce RTX 5060 Ti 8GB | B | 49.3 | 41.0 | 25.4 | 8GB | 51.5% † |
| 28 | Radeon RX 9060 XT 16GB | B | 48.2 | 40.2 | 31.7 | 16GB | 65.8% |
| 29 | GeForce RTX 3070 Ti | B | 46.4 | 40.0 | 23.5 | 8GB | 50.6% † |
| 30 | Radeon RX 9060 XT 8GB | C | 45.7 | 37.3 | 26.8 | 8GB | 58.6% † |
| 31 | GeForce RTX 4060 Ti 16GB | C | 43.8 | 36.2 | 28.2 | 16GB | 64.4% |
| 32 | GeForce RTX 5060 | C | 43.4 | 35.8 | 19.6 | 8GB | 45.2% † |
| 33 | GeForce RTX 4060 Ti 8GB | C | 43.2 | 35.2 | 21.5 | 8GB | 49.8% † |
| 34 | GeForce RTX 3070 | C | 42.8 | 34.8 | 23.6 | 8GB | 55.1% † |
| 35 | Radeon RX 6750 XT | C | 40.8 | 34.4 | 26.7 | 12GB | 65.4% |
| 36 | Radeon RX 6700 XT | C | 38.9 | 32.5 | 25.3 | 12GB | 65.0% |
| 37 | GeForce RTX 3060 Ti | C | 36.4 | 30.5 | 17.5 | 8GB | 48.1% † |
| 38 | Intel Arc B580 | C | 35.1 | 30.3 | 24.9 | 12GB | 70.9% |
| 39 | GeForce RTX 4060 | D | 35.1 | 28.4 | 15.7 | 8GB | 44.7% † |
| 40 | Radeon RX 7600 | D | 34.3 | 27.2 | 16.6 | 8GB | 48.4% † |
| 41 | GeForce RTX 5050 | D | 34.0 | 27.1 | 15.4 | 8GB | 45.3% † |
| 42 | Intel Arc B570 | D | 31.1 | 26.5 | 17.7 | 10GB | 56.9% |
| 43 | GeForce RTX 3060 12GB | D | 30.2 | 25.0 | 20.0 | 12GB | 66.2% |
Laptop GPUs are not in this desktop list. AMD added support for the Radeon RX 9050 after Tom’s June update: AMD’s Adrenalin 26.7.1 release notes, dated July 28, 2026, list it under new product support, and its product page gives it 8 GB of GDDR6 on a 128-bit bus. Tom’s table has no score for it, and a Newegg search for it returned no listings on September 22, 2026. NVIDIA’s RTX 5060 family and RTX 5050 specification pages list the 8GB and 16GB variants in the table.
If you own one of these
Tom’s June 24, 2026 table ranks five cards on the same bench that my main table leaves out, the RX 7600 XT, RX 6600 XT, RX 6650 XT, RTX 3050 and RX 6600. Those are cards people upgrade from, so they sit here with six older cards from the main table, sorted by 1440p score.
FPS is Tom’s average at 1080p and 1440p Ultra, the geometric mean of its 11 raster games on a Ryzen 7 9800X3D. Tier applies my cutoffs to the 1440p score. Each multiple divides the FPS of the card a higher tier starts with (RX 9060 XT 8GB for C, RX 9070 GRE for B, RX 7900 XT for A, RTX 5090 for S) by yours. A linked name opens the GPU comparison tool against the first card of the next tier up. The five cards the main table leaves out are not in the tool.
| Model | Avg FPS, 1080p / 1440p | Tier | × at 1080p | × at 1440p |
|---|---|---|---|---|
| RTX 3070 | 87.2 / 58.2 | C | B 1.38 A 1.67 S 2.34 | B 1.49 A 1.86 S 2.87 |
| RX 6700 XT | 79.2 / 54.3 | C | B 1.52 A 1.84 S 2.57 | B 1.59 A 1.99 S 3.08 |
| RTX 3060 Ti | 74.2 / 51.0 | C | B 1.63 A 1.96 S 2.75 | B 1.70 A 2.12 S 3.28 |
| RX 7600 XT | – / 50.2 | C | – | B 1.73 A 2.15 S 3.33 |
| RTX 4060 | 71.5 / 47.6 | D | C 1.30 B 1.69 A 2.03 S 2.85 | C 1.31 B 1.82 A 2.27 S 3.51 |
| RX 7600 | 69.9 / 45.4 | D | C 1.33 B 1.73 A 2.08 S 2.92 | C 1.38 B 1.91 A 2.38 S 3.69 |
| RTX 3060 12GB | 61.5 / 41.9 | D | C 1.52 B 1.96 A 2.36 S 3.31 | C 1.49 B 2.07 A 2.58 S 3.99 |
| RX 6600 XT | 62.7 / 40.7 | D | C 1.49 B 1.92 A 2.32 S 3.25 | C 1.54 B 2.13 A 2.65 S 4.11 |
| RX 6650 XT | 64.3 / 38.0 | D | C 1.45 B 1.88 A 2.26 S 3.17 | C 1.64 B 2.28 A 2.84 S 4.40 |
| RTX 3050 | 44.6 / 29.8 | D | C 2.09 B 2.70 A 3.26 S 4.57 | C 2.10 B 2.91 A 3.62 S 5.61 |
| RX 6600 | 51.9 / – | D | C 1.80 B 2.32 A 2.80 S 3.93 | – |
The multiples are averages across that suite, not a promise for any one game. Most cards I compare first in the resolution table sit lower in their tiers. An RTX 3060 12GB to an RTX 5070 is 96.4 / 41.9 = 2.30× at 1440p, an RTX 3050 to an RTX 5060 is 88.5 / 44.6 = 1.98× at 1080p, and an RX 6600 XT to an RX 9060 XT 16GB is 67.3 / 40.7 = 1.65× at 1440p.
A dash marks two of Tom’s cells I leave blank, along with the multiples built on them. The RX 6600 at 1440p reads 24.8 FPS, 48% of its 1080p rate, where the RX 6600 XT, RX 6650 XT and RTX 3050 keep 59% to 67%. The RX 7600 XT at 1080p reads 102.1 FPS, 46% ahead of the RX 7600, where 1440p puts the two 11% apart. The RX 6600 is D either way. At 1080p it trails every card in the main table.
Older cards such as the RTX 2060, GTX 1660 Super and RX 580 are not in Tom’s 2026 table. Its legacy pages use older game suites and CPUs and are no longer updated, so I do not place them here.
The 8GB problem
Retention catches the upgrade that looks stronger until the resolution changes. The cleanest test is two memory variants of one GPU, calculated from the score columns above:
| Memory-variant pair | 8GB retention | 16GB retention | Retention gap |
|---|---|---|---|
| RTX 4060 Ti | 21.5 / 43.2 = 49.8% | 28.2 / 43.8 = 64.4% | 14.6 points |
| RTX 5060 Ti | 25.4 / 49.3 = 51.5% | 36.3 / 51.6 = 70.3% | 18.8 points |
| RX 9060 XT | 26.8 / 45.7 = 58.6% | 31.7 / 48.2 = 65.8% | 7.1 points |
I calculate the gaps before rounding, which is why the RX 9060 XT gap reads 7.1.
The RTX 5060 Ti pair isolates memory best. NVIDIA lists both variants in one specification column: 4,608 CUDA cores, a 2.57 GHz boost clock and a 128-bit GDDR7 bus, with 16 GB or 8 GB as the only split. At 1440p the two score 43.9 and 41.0, close enough to share a tier. At 4K they score 36.3 and 25.4, so the 8GB card gives up 30% of its standing on the same GPU. Above 1080p, I buy the 16GB card. The RTX 4060 Ti pair shows the same split. Both variants sit in C at 1440p, 36.2 and 35.2, then separate at 4K, 28.2 against 21.5.
Across brands, the order flips. The RTX 5060 Ti 8GB leads the RX 9060 XT 16GB 41.0 to 40.2 at 1440p and trails it 25.4 to 31.7 at 4K. I start with the Radeon. The 8GB GeForce has to win in my own games to change that.
A rank reversal I would check before upgrading
The RTX 3070 Ti ranks above the RTX 4060 Ti 16GB: 40.0 against 36.2 at 1440p, about a 10.5% lead. At 4K it scores 23.5 against 28.2, about a 16.7% deficit, using the RTX 4060 Ti 16GB as the baseline both times. Both share the leader in each column, so the ratio holds.
For a planned monitor upgrade, I put both cards into the GPU comparison tool, switch resolutions, then look for results in the games that made me want to upgrade.
What retention cannot tell me
Retention measures relative standing. It is not the share of FPS a card keeps. The leader reads 100% by construction, and a card that starts low at 1080p can post good retention with a weak 4K score.
The Arc B580 is the trap. Its retention is 70.9%, but its 4K score is 24.9 against the RTX 5080’s 69.8. It does not belong on a 4K shortlist.
I would keep a working 8GB card. I lower texture quality first, then judge frame pacing and image quality in my own games, and nothing in these aggregate scores is a reason to replace a card that already runs them well.
NVIDIA GPU tier list
| Brand rank | Tier | GPUs in descending 1440p order |
|---|---|---|
| 1-6 | S | RTX 5090 → RTX 4090 → RTX 5080 → RTX 4080 Super → RTX 4080 → RTX 5070 Ti |
| 7-13 | A | RTX 4070 Ti Super → RTX 3090 Ti → RTX 4070 Ti → RTX 5070 → RTX 3090 → RTX 4070 Super → RTX 3080 Ti |
| 14-18 | B | RTX 3080 (10GB) → RTX 4070 → RTX 5060 Ti 16GB → RTX 5060 Ti 8GB → RTX 3070 Ti |
| 19-23 | C | RTX 4060 Ti 16GB → RTX 5060 → RTX 4060 Ti 8GB → RTX 3070 → RTX 3060 Ti |
| 24-26 | D | RTX 4060 → RTX 5050 → RTX 3060 12GB |
The RTX 5090 leads. My 4K starting point is the RTX 5070 Ti. I move up only when a game I play needs it. For 1440p I compare the RTX 5060 Ti 16GB with the RTX 5070, and pay for the 5070 when the 5060 Ti falls short in a game I actually play.
My own 4K raster index agrees with the top of this list. With the RTX 4080 Super set to 100, I measured the RTX 4080 at 96 and the RTX 5080 Founders Edition at 114 on my 2024-2025 test bench. Tom’s June 4K scores put the same two cards at 97.3 and 111.5 against the 4080 Super.
The RTX 5060 Ti 8GB lands in the same B band as its 16GB sibling. The letter hides the reason to choose between them. Where two GeForce cards sit a rung apart, I have written the comparison out: RTX 5070 vs 5070 Ti, RTX 4080 vs RTX 4090, and the RTX 5060 Ti vs RX 9060 XT 1440p showdown for the cross-brand version of the same question.
Frame generation stays out of these scores. It raises the FPS counter without lowering latency, and my own Astral RTX 5080 shows it: Cyberpunk 2077 at 4K with path tracing runs 19 FPS native, 40 FPS with DLSS Quality and 135 FPS with 4x Multi Frame Generation, while PC latency goes from 95 ms to 45 ms and then back up to 62 ms. NVIDIA’s DLSS page, checked September 13, 2026, lists which RTX generations get each feature.
AMD GPU tier list
| Brand rank | Tier | GPUs in descending 1440p order |
|---|---|---|
| 1-2 | S | RX 7900 XTX → RX 9070 XT |
| 3-5 | A | RX 7900 XT → RX 9070 → RX 6950 XT |
| 6-11 | B | RX 9070 GRE → RX 7800 XT → RX 6900 XT → RX 6800 XT → RX 7700 XT → RX 9060 XT 16GB |
| 12-14 | C | RX 9060 XT 8GB → RX 6750 XT → RX 6700 XT |
| 15 | D | RX 7600 |
The RX 7900 XTX leads this raster list. The newer RX 9070 XT is second. My 4K shortlist starts with the RX 9070 XT against the RX 7900 XTX, and against GeForce the RTX 5070 Ti vs RX 9070 XT comparison carries the cross-brand argument. For 1440p I compare the RX 9060 XT 16GB with the RX 9070. The RX 9070 GRE and RX 7800 XT sit 1.1 points apart at 1440p, close enough that your games decide it.
The RX 9060 XT split follows the GeForce pairs. The 16GB version holds more standing, and neither version is a 4K card. For upscaling, AMD’s FSR page, read September 13, 2026, lists supported games and hardware. Support depends on the feature and the card, so I add no FSR bonus to these native scores.
Where Intel Arc fits
The Arc B580 is C tier with a 30.3 score at 1440p and 70.9% retention; the B570 is D with 26.5 and 56.9%. I shortlist both for a settings-flexible 1080p build. The B580’s retention does not make it a 1440p card.
Platform support comes first here. Intel’s B-Series desktop quick-start guide, checked September 13, 2026, requires Resizable BAR or Smart Access Memory enabled for optimal performance. On an older PC, I confirm the motherboard supports it and that it is switched on before recommending either Arc as an upgrade.
My RTX 5080 measurement
The link in the RTX 5080 row is 32,350 in 3DMark Time Spy Graphics on the Astral Stock profile, measured on my ASUS ROG Astral RTX 5080 OC with a Ryzen 7 7800X3D and 64 GB of DDR5-6000. That is the Graphics sub-score, not the combined Time Spy score; UL’s Time Spy scoring documentation, checked September 13, separates the two. The first-party dataset holds that run, the rest of the 3DMark ladder, the 4K game results and the 4K raster index quoted in the NVIDIA section.
The full ROG Astral RTX 5080 OC review covers the board itself. If you own a card from any tier, my GPU undervolting guide and the community undervolt settings database are where I would go next.
Before buying a particular board, run your parts through the PSU wattage calculator, then check the maker’s dimensions and power connector. The ASUS Astral specification page, checked September 13, 2026, lists both for my card. A performance tier does not tell you whether a card fits your case.
Sources
- Tom’s Hardware GPU benchmarks hierarchy - June 24, 2026 native Ultra raster scores, re-checked September 22, 2026, and the average FPS in the upgrade table, read September 24, 2026. Retention and the S-D cutoffs are my arithmetic and my calls.
- NVIDIA DLSS documentation - feature compatibility by RTX generation. The RTX 5060 family page, checked September 22, 2026, gives the RTX 5060 Ti’s shared specification column; the RTX 5050 specifications support its memory configuration.
- AMD FSR technologies - supported games and hardware for FSR.
- AMD Adrenalin 26.7.1 release notes and the Radeon RX 9050 product page, both read September 22, 2026 - the RX 9050’s July 28 addition and its memory configuration.
- Intel Arc desktop quick-start guide - the B-Series Resizable BAR requirement.
- UL Benchmarks: Time Spy score calculation - defines the Graphics sub-score.
- ASUS ROG Astral RTX 5080 OC specifications - the measured board and its physical requirements.
- TechFuelHQ Astral RTX 5080 OC dataset - my Time Spy Graphics run, 4K Cyberpunk 2077 results, the DLSS 4 frame-generation ladder, and the 4K raster index for the RTX 4080, RTX 4080 Super and RTX 5080 Founders Edition.
Frequently asked questions
How is this GPU hierarchy ranked?
What GPU tier should I choose for 1080p, 1440p or 4K?
Is an 8GB GPU still enough for gaming?
What is my older GPU comparable to?
What is the fastest NVIDIA or AMD GPU in this hierarchy?
Does this GPU tier list include ray tracing, DLSS or FSR?
Does 4K retention mean the percentage of FPS I keep?
Sources and corrections
- Last updated
- Methodology
- See our methodology for research and review standards.
- Update log
- 2026-09-24 — Page updated.
- Corrections
- Spotted an error or a stale number? Email contact@techfuelhq.com. Confirmed corrections are added to the update log above.