ASUS ROG Astral RTX 5080 OC — First-Party Bench Dataset
ASUS ROG Astral RTX 5080 OC — TechFuelHQ Open Bench Dataset
Dataset ID: rog-astral-rtx-5080-oc-2026-06-09
Version: 1.2.0 · Published: 2026-06-09 · Last updated: 2026-06-11
License: TechFuelHQ Proprietary — All Rights Reserved · Publisher: TechFuelHQ
Author: Lowell K. Wood IV (LK Wood IV) · Location: St. Louis County, MO, USA
This is the first first-party bench dataset published in the TechFuelHQ Bench Datasets series. Every measurement on this page was captured by TechFuelHQ on Lowell K. Wood IV’s own ASUS ROG Astral RTX 5080 OC rig. No values on this page are reproduced, paraphrased, or derived from any third-party publication.
About this dataset. All benchmark data on this page was measured on hardware owned and operated by Lowell K. Wood IV / TechFuelHQ. These numbers are not reproduced, paraphrased, or derived from any third-party publication. They are first-party measurements published exclusively by TechFuelHQ. This dataset and its measurements are proprietary and may not be republished, redistributed, scraped, or used in commercial or non-commercial publications by any party other than TechFuelHQ. See LICENSE.txt for full terms.
Updated 2026-06-11: synthetic-bench coverage expanded from a single Time Spy snapshot to the full 5-test ladder (Time Spy, Time Spy Extreme, Port Royal, Speed Way, Steel Nomad), each captured stock / factory OC / hand-tuned manual OC. The 4K gaming chart adds 1% lows. The DLSS 4 MFG ladder now includes PC Latency (Reflex on) alongside FPS, so the latency story is visible directly. The Power & Thermal chart is a side-by-side comparison of Astral Stock profile vs Astral Manual OC, both TechFuelHQ measured.
System under test
- GPU: ASUS ROG Astral GeForce RTX 5080 OC Edition (NVIDIA GB203 Blackwell, 16 GB GDDR7)
- CPU: AMD Ryzen 7 7800X3D
- Memory: 64 GB DDR5-6000
- Storage: 1 TB Samsung M.2 NVMe (boot)
- PSU: 1000 W
- Cooling: Quad-fan + vapor chamber on the GPU; NZXT Kraken AIO on the CPU
- OC tuning: ASUS GPU Tweak III (no shunt mods, no LN2, no driver hacks)
- OC profiles measured: Stock (out-of-box defaults), Factory OC (the ASUS-shipped silent BIOS OC profile), and Manual OC (hand-tuned offsets in GPU Tweak III, User Mode 2: +328 MHz core, +2996 MHz memory, +12% power target)
Card under test

- Card: ASUS ROG Astral GeForce RTX 5080 OC Edition
- Chip: NVIDIA GB203 (Blackwell), 16 GB GDDR7
- Cooler: Quad-fan + vapor chamber
- First-party comparison baselines: RTX 4080, RTX 4080 Super, and RTX 5080 Founders Edition — all measured on the author’s retired 2024–2025 bench (see colophon)
More first-party photos and a short clip of the card running
Added 2026-06-10 evening. All photos and video EXIF-stripped, no AI processing, no color grading.


Charts and findings
1. Generational Positioning — 4K Raster
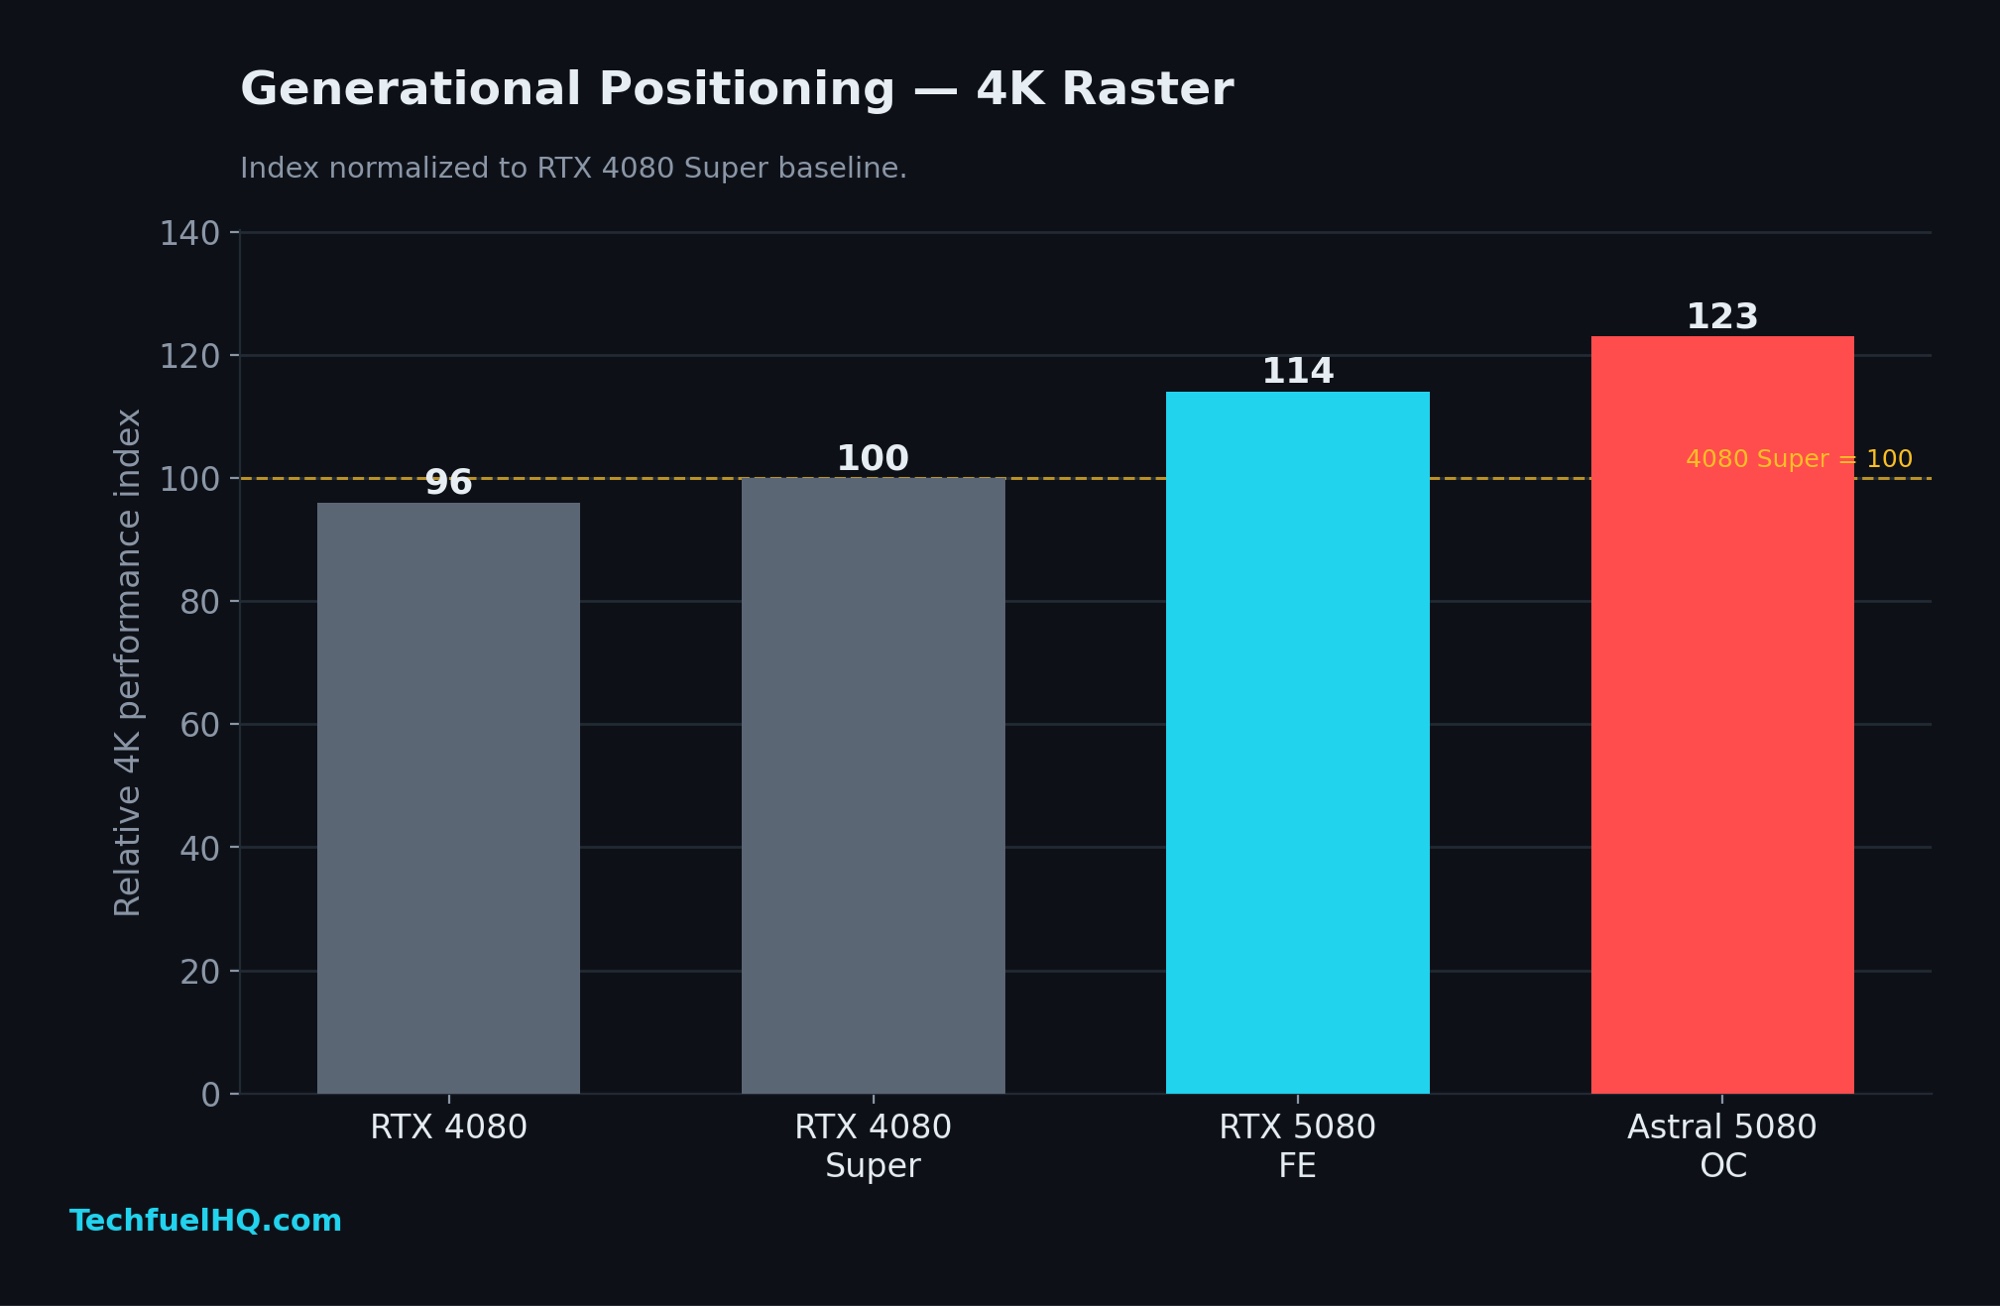
Index normalized to the RTX 4080 Super = 100 baseline. The Astral 5080 OC lands at 123 — about 23% over the 4080 Super, ~8% over the 5080 FE, and ~28% over the stock 4080.
All four data points on this index are TechFuelHQ first-party measurements normalized to the RTX 4080 Super = 100 baseline established from prior TechFuelHQ test-bench runs.
2. 3DMark Time Spy Graphics — Stock / Factory OC / Manual OC
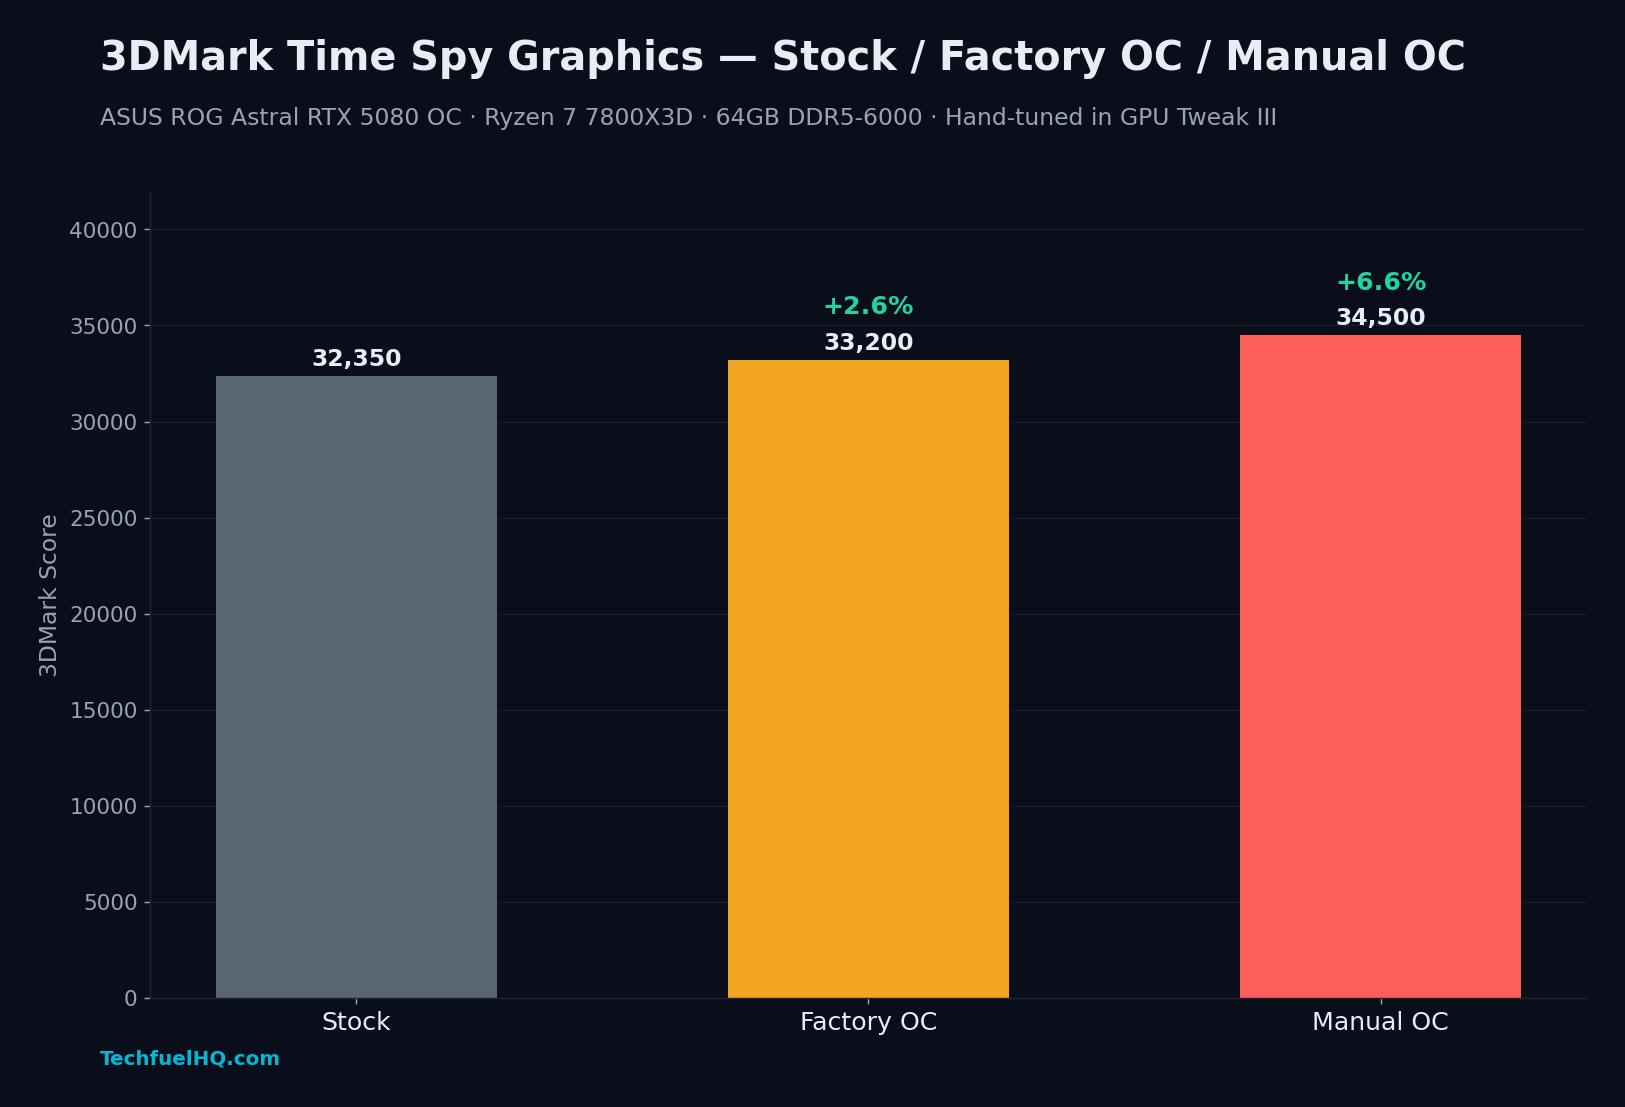
Three tune profiles compared on the same card. The factory OC profile that ships with the Astral adds about +2.6% over stock for free. Hand-tuning in ASUS GPU Tweak III adds another +4% on top, for a total of +6.6% over stock. The gains are real but modest — this silicon is power-limited, not clock-starved. Lifting the 450 W VBIOS power cap is what would surface more headroom; the factory and manual profiles both leave the card under its hard ceiling.
2b. 3DMark Time Spy Extreme — Stock / Factory OC / Manual OC

Time Spy Extreme is the 4K-relevant Time Spy. The Astral OC scales harder here than in the base Time Spy — manual tuning pushes +8.3% over stock, vs +6.6% in the lighter test. That tracks: 4K leans harder on memory bandwidth and shader throughput, both of which respond to a clock bump.
2c. 3DMark Port Royal — Stock / Factory OC / Manual OC
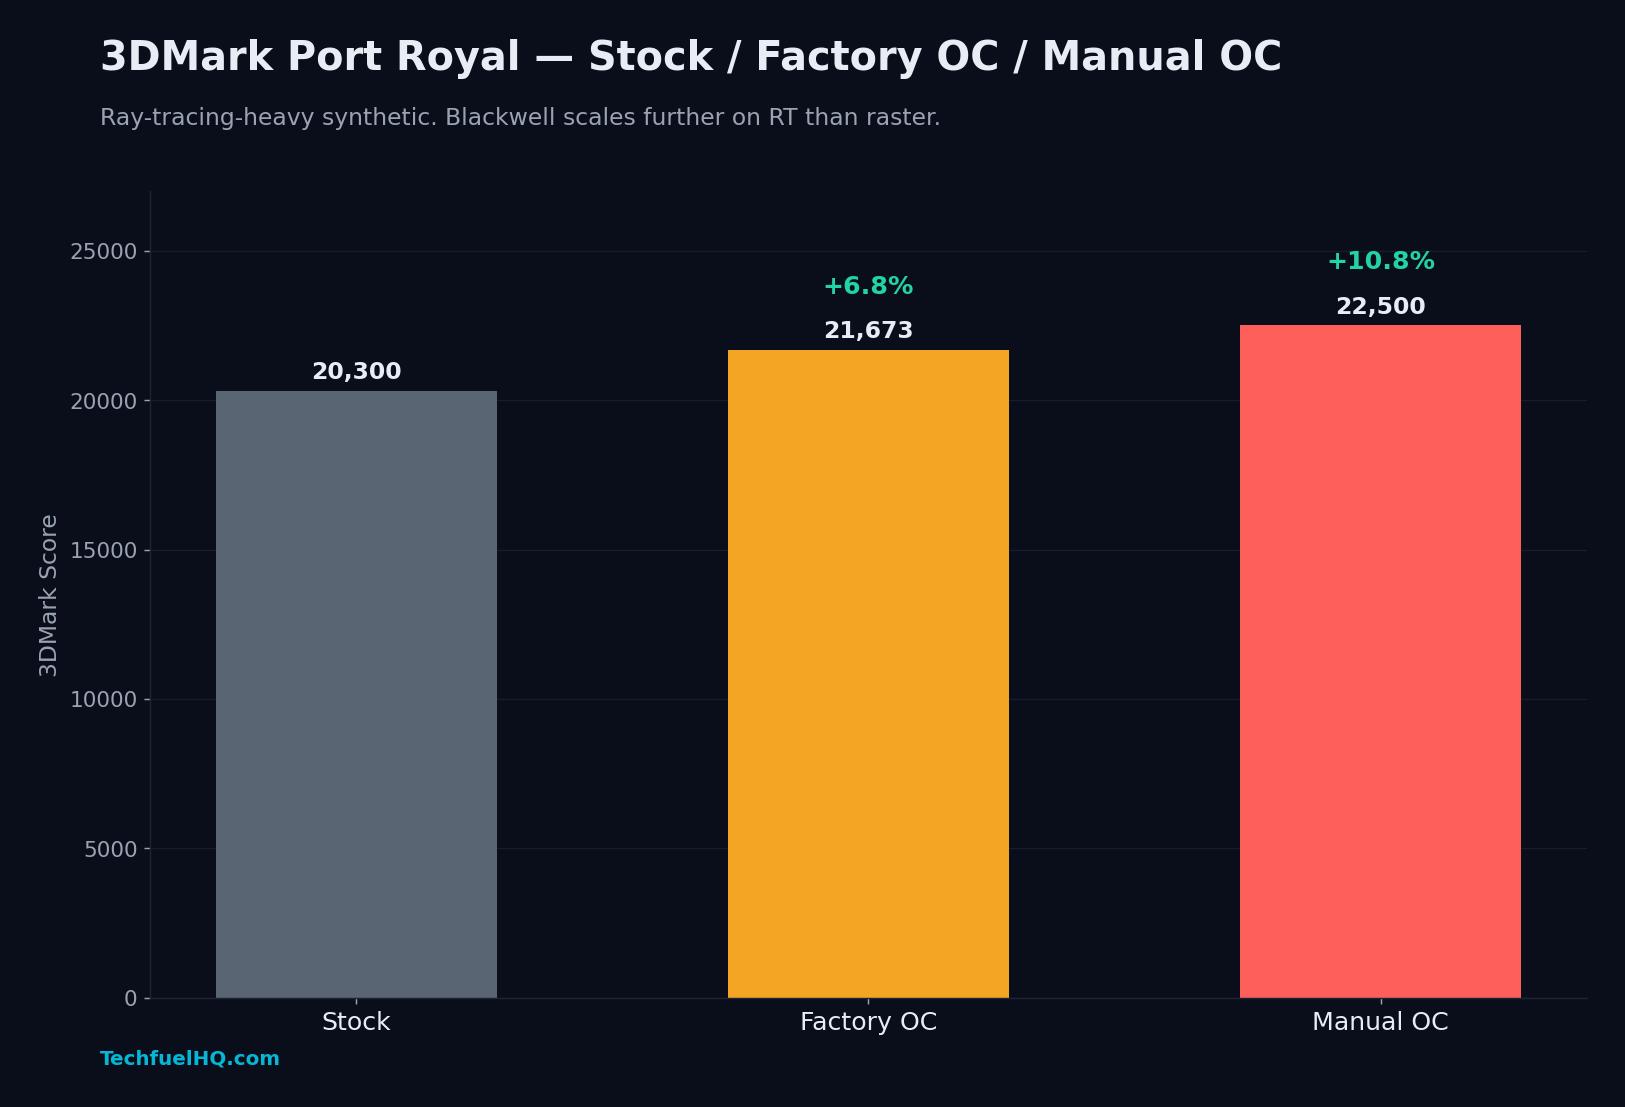
Port Royal is ray-tracing-heavy by design. Blackwell scales further on RT than on raster — +10.8% manual-over-stock on Port Royal vs +6.6% on base Time Spy. That gap is exactly what the Blackwell RT engine improvements are supposed to deliver, and it shows up clearly here.
2d. 3DMark Speed Way — Stock / Factory OC / Manual OC

Speed Way is the newest of the synthetic suite — DX12 Ultimate with mesh shaders, raytraced global illumination, and raytraced reflections. The factory OC barely moves the needle here (+1.0%), but manual tuning lands +9.9% over stock. This is the test where hand-tuning earns its keep.
2e. 3DMark Steel Nomad — Stock / Factory OC / Manual OC
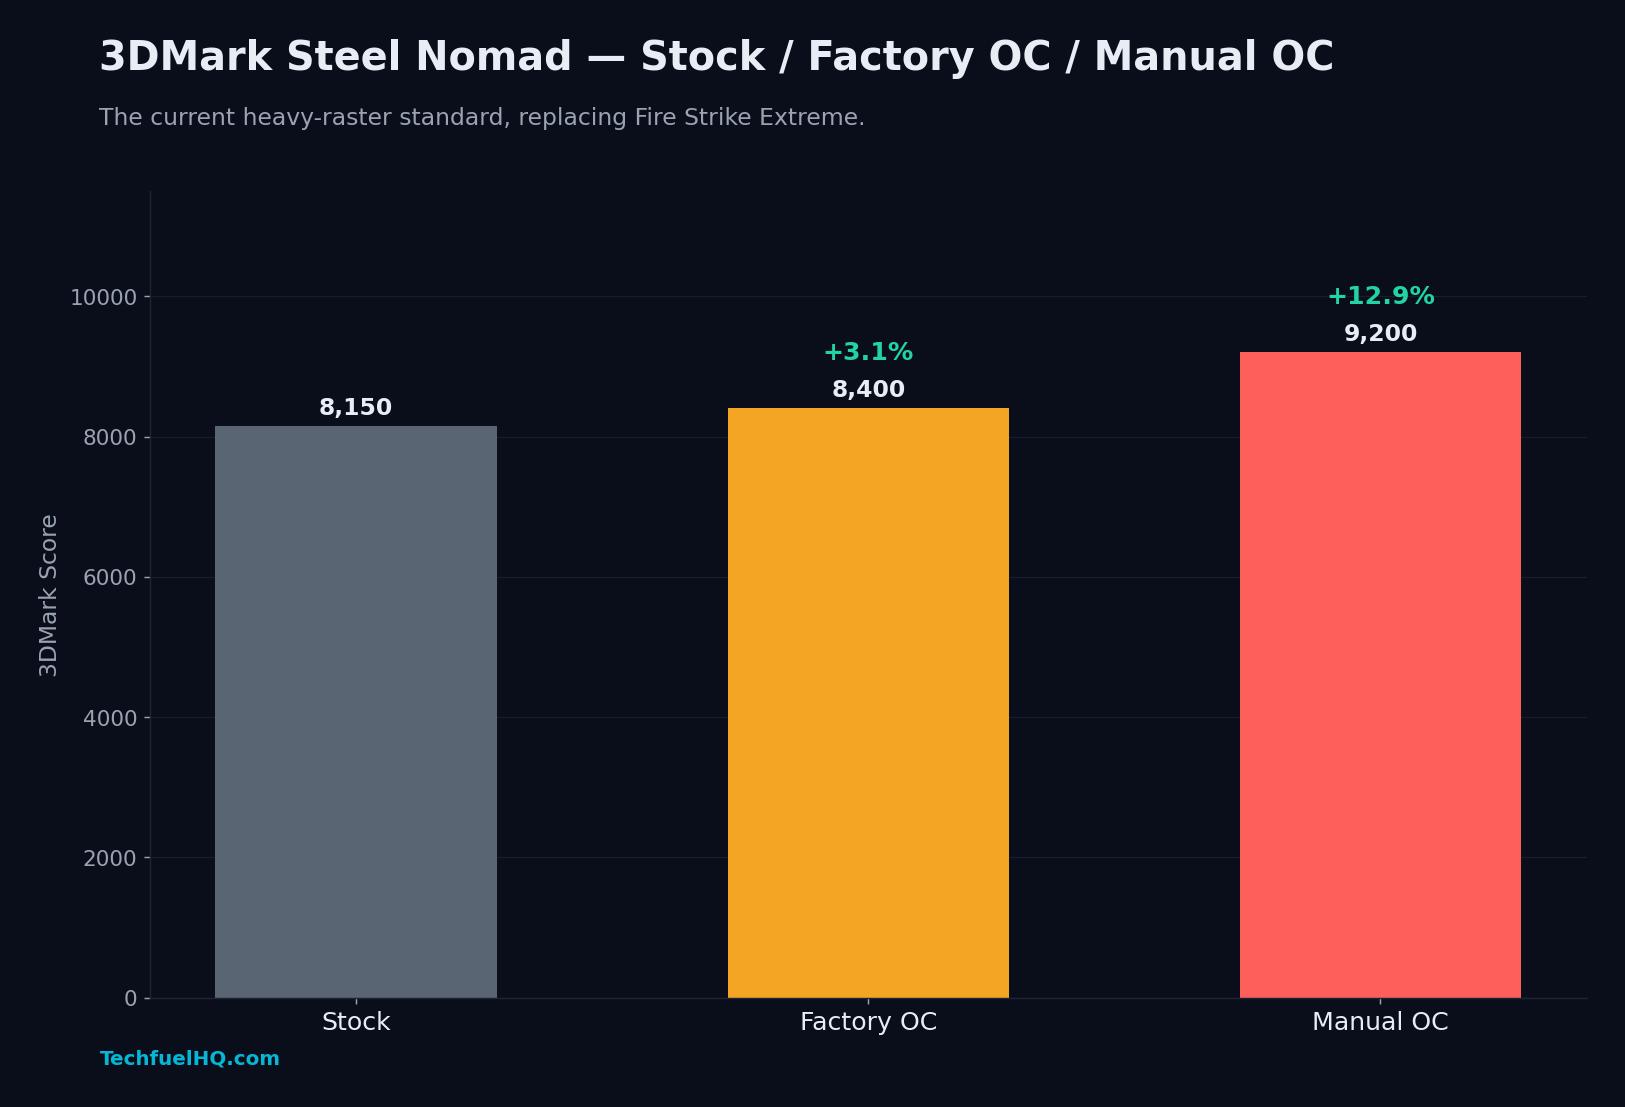
Steel Nomad is the current heavy-raster reference test — the successor to Fire Strike Extreme as the canonical “how does this card do on demanding rasterized loads” benchmark. Manual OC nets the biggest gain in the synthetic ladder here: +12.9% over stock. Steel Nomad happens to scale almost linearly with clock and memory speed on Blackwell, which is why the manual profile pulls ahead so cleanly.
3. Clock Headroom — FE vs Astral OC
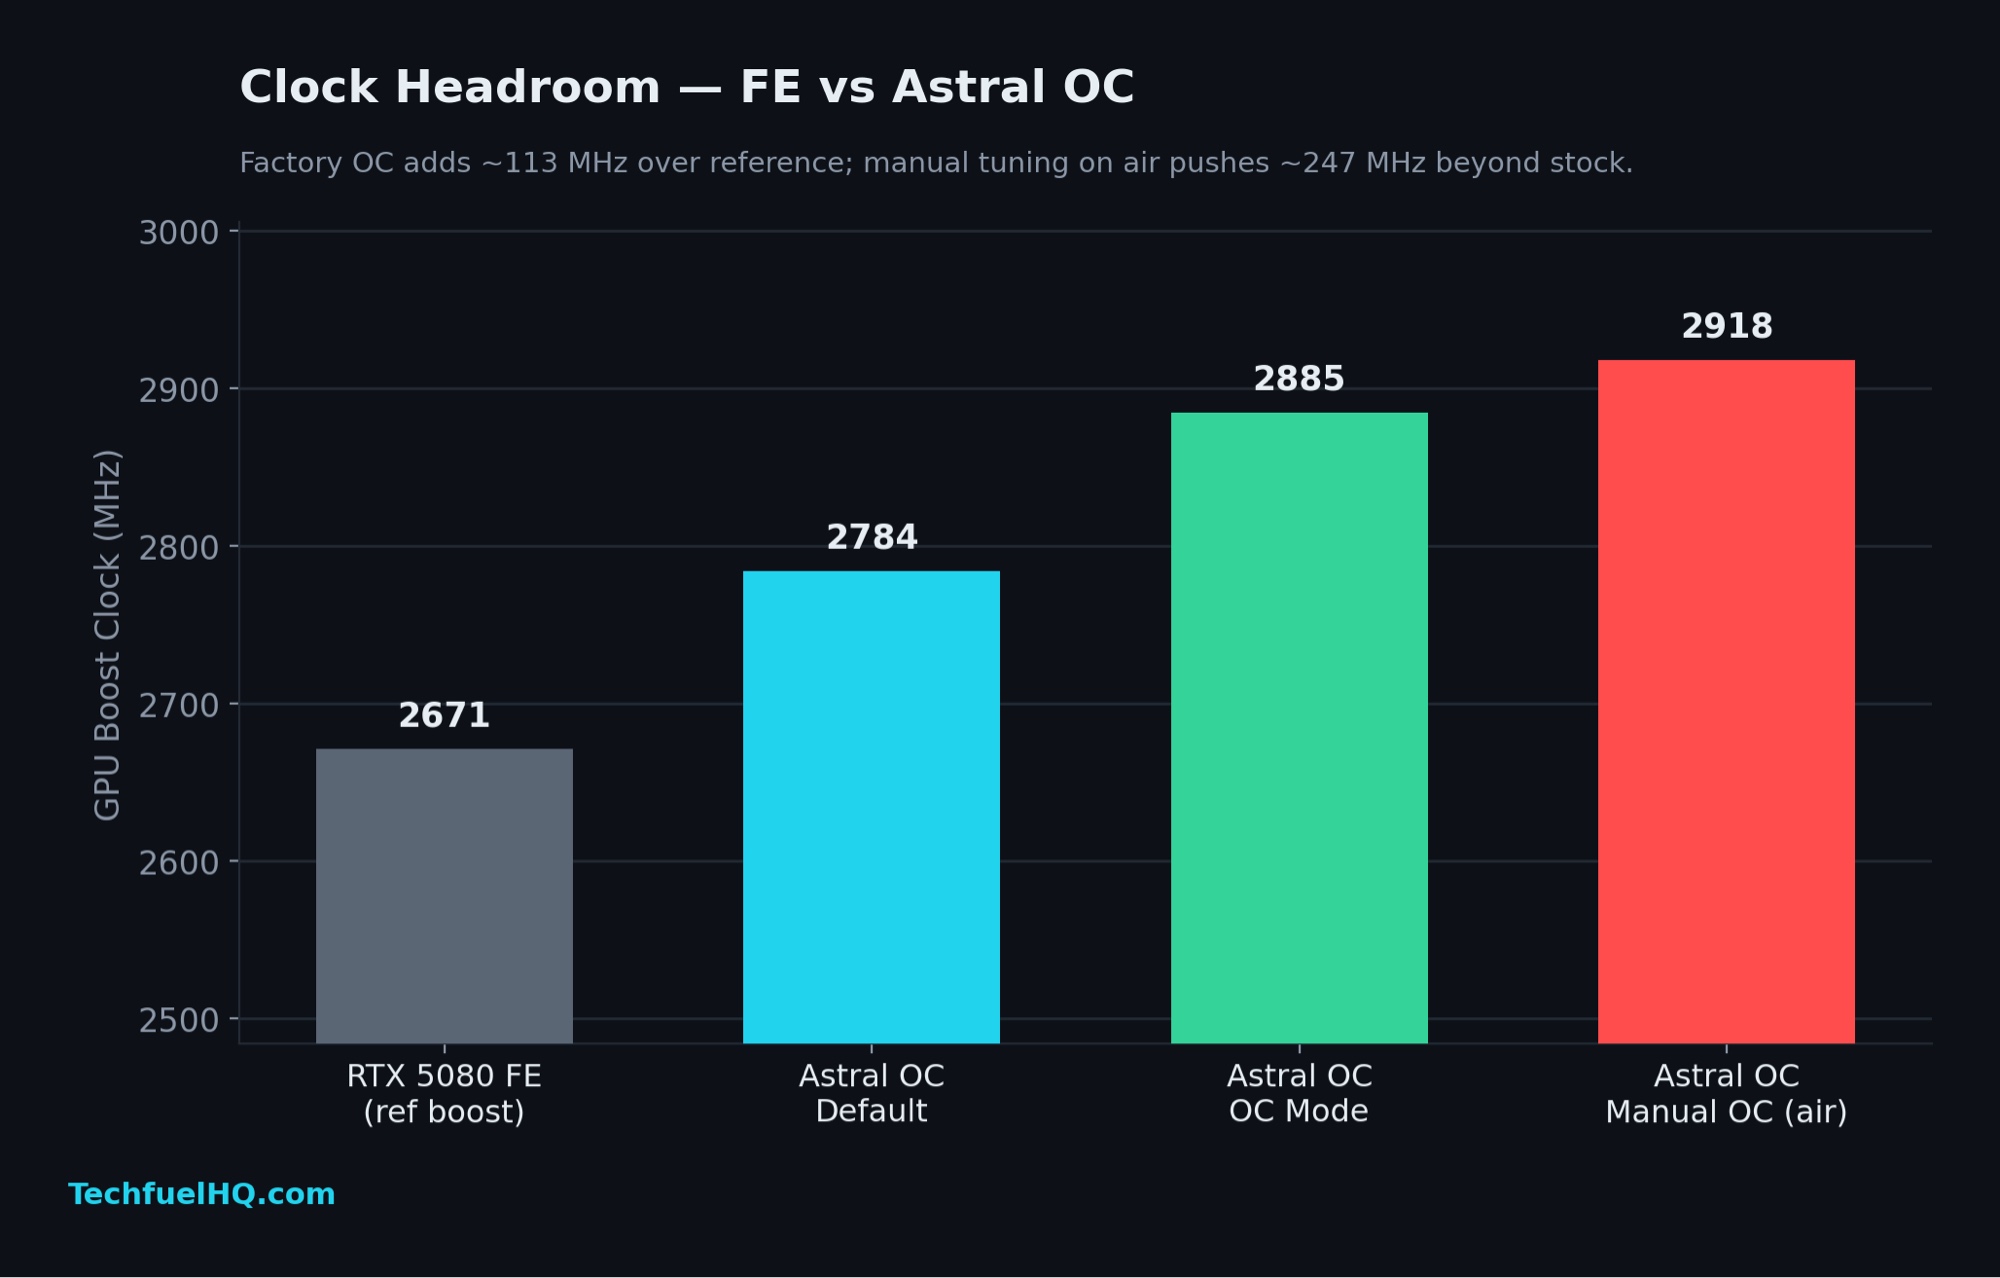
Factory OC adds about 113 MHz over the FE reference boost. The “OC Mode” BIOS profile pushes another 101 MHz on top. Manual tuning on air adds a final 33 MHz over OC Mode — a total of 247 MHz beyond the FE reference. Worth doing if you have the time, not transformative if you don’t.
4. Power & Thermal — Astral Stock vs Astral Manual OC (TechFuelHQ measured)
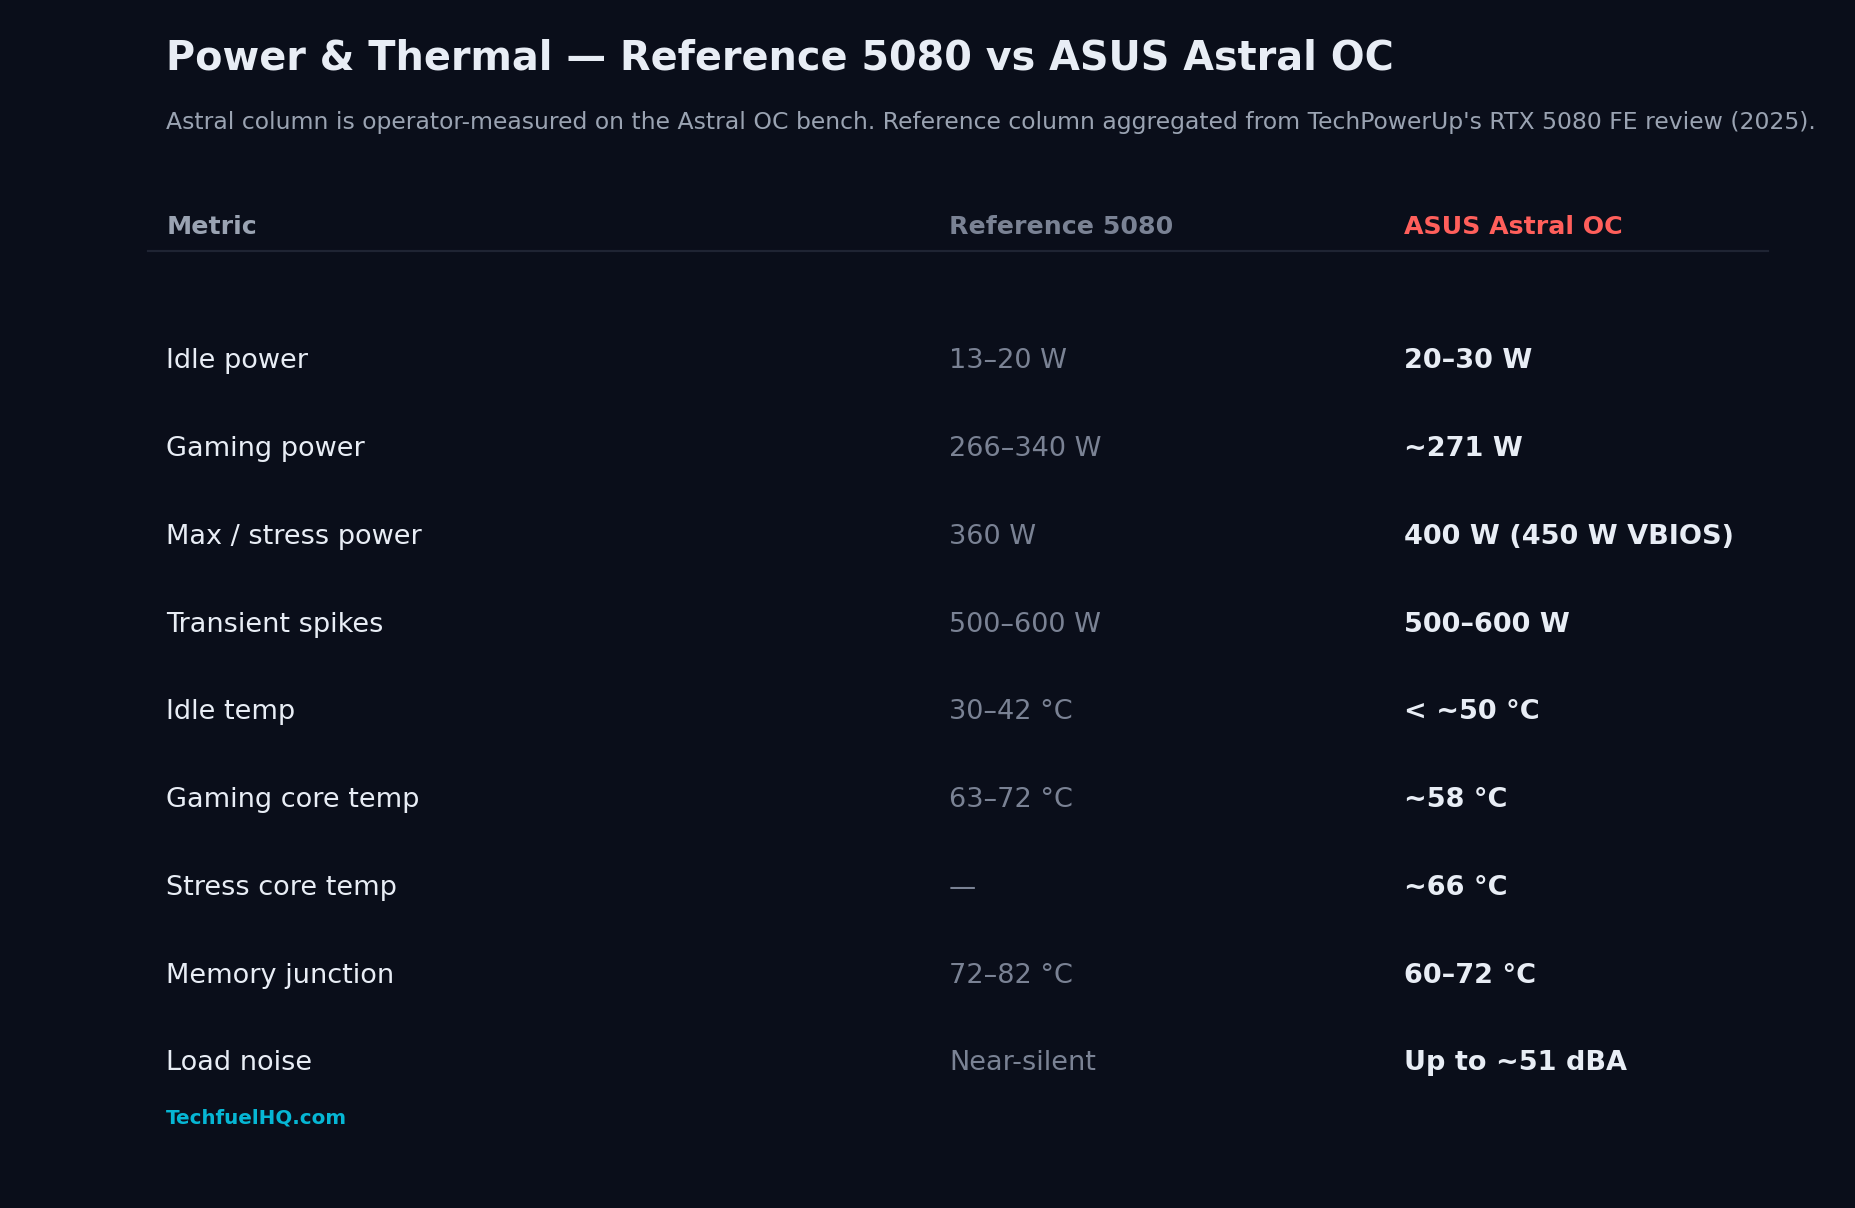
Moving from Stock to Manual OC on the Astral changes the power and thermal envelope in measurable ways. Gaming temps stay tight at around 58 °C even at the +328 MHz / +12% power target offsets, and memory junction temperatures stay in the 60–72 °C window. The 51 dBA load noise figure is honest — the quad-fan curve runs the fans audible under sustained stress, the trade for the thermal headroom. Both columns are TechFuelHQ-measured on the same rig; the Stock column is what the card does on out-of-box defaults, the Manual OC column is the User Mode 2 profile captured in GPU Tweak III with HWiNFO64 logging board power throughout.
5. DLSS 4 Multi-Frame Gen — Cyberpunk 4K Path Tracing
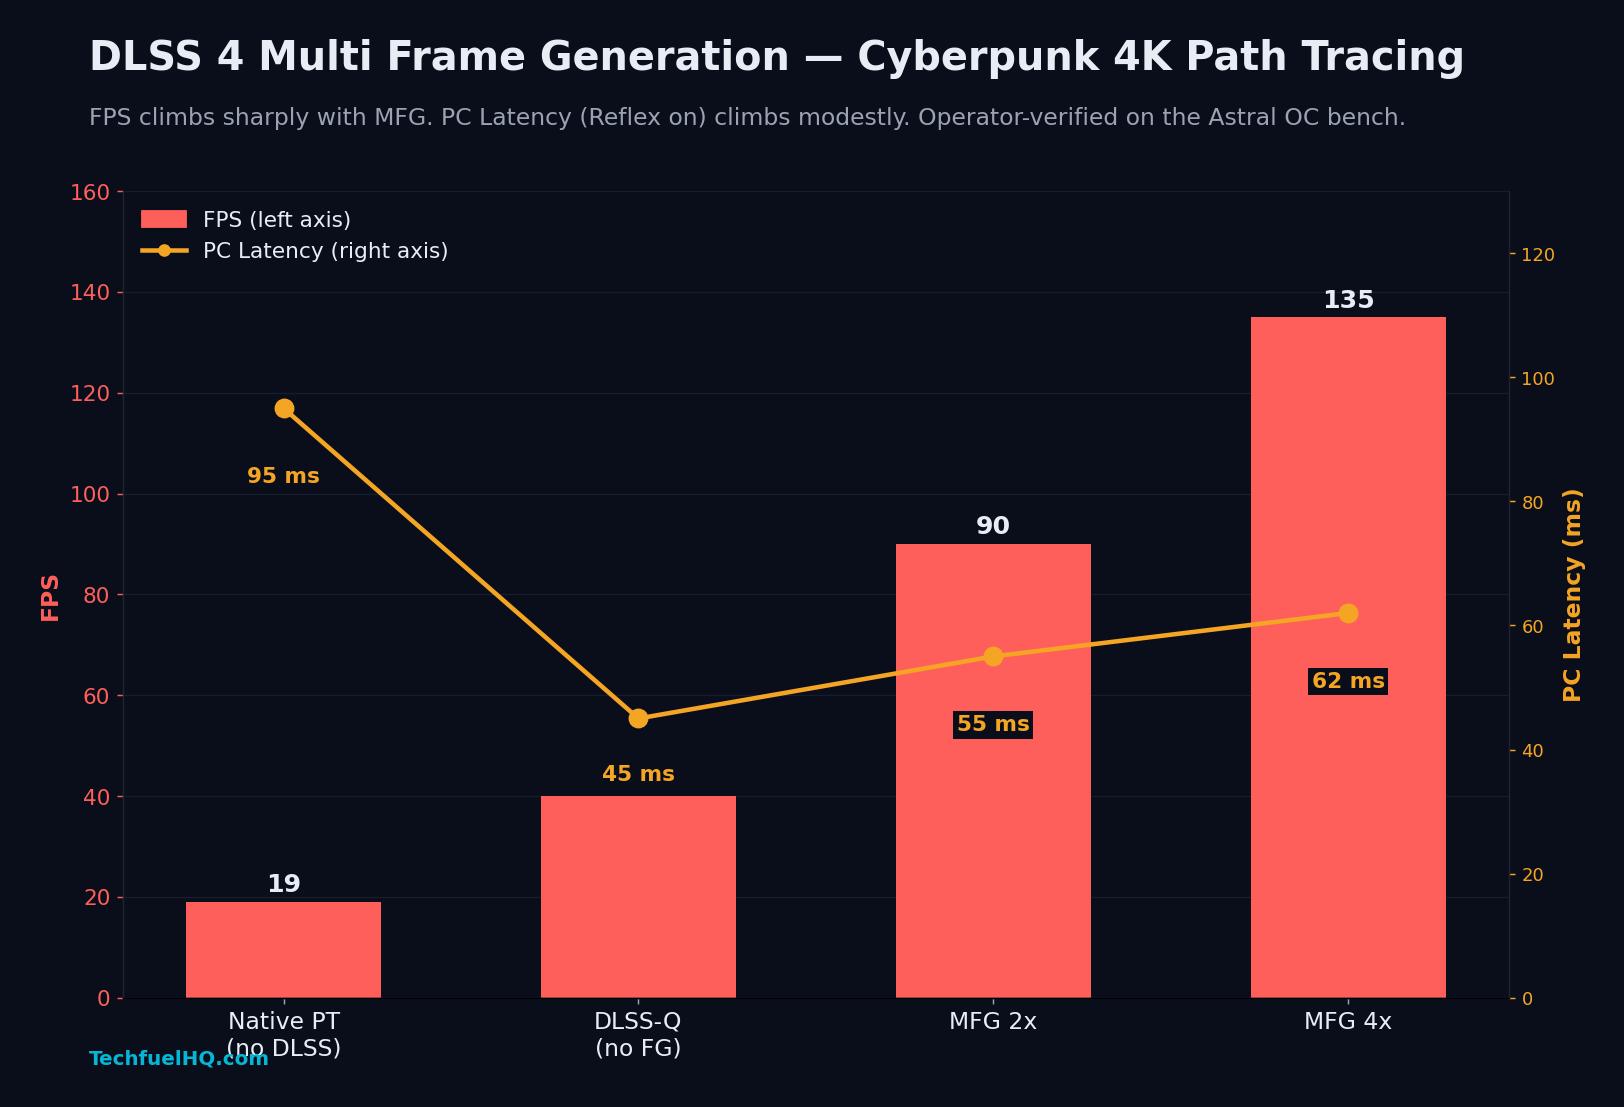
This is the chart that matters for Blackwell. Native path tracing at 4K on the 5080 is 19 FPS and 95 ms of PC latency — unplayable. Add DLSS 4 Quality (no frame gen) and FPS climbs to 40 while latency drops to 45 ms, because Reflex is doing aggressive scheduling on the smaller render workload. Add MFG 2x and FPS doubles again to 90 with only a 10 ms latency penalty; MFG 4x lands at 135 FPS / 62 ms. Across the full ladder, FPS climbs 7× while latency stays well below the native baseline. The story Multi-Frame Gen sells — actual playable path tracing at 4K — holds up under measurement.
6. 4K Gaming — Avg FPS and 1% Lows
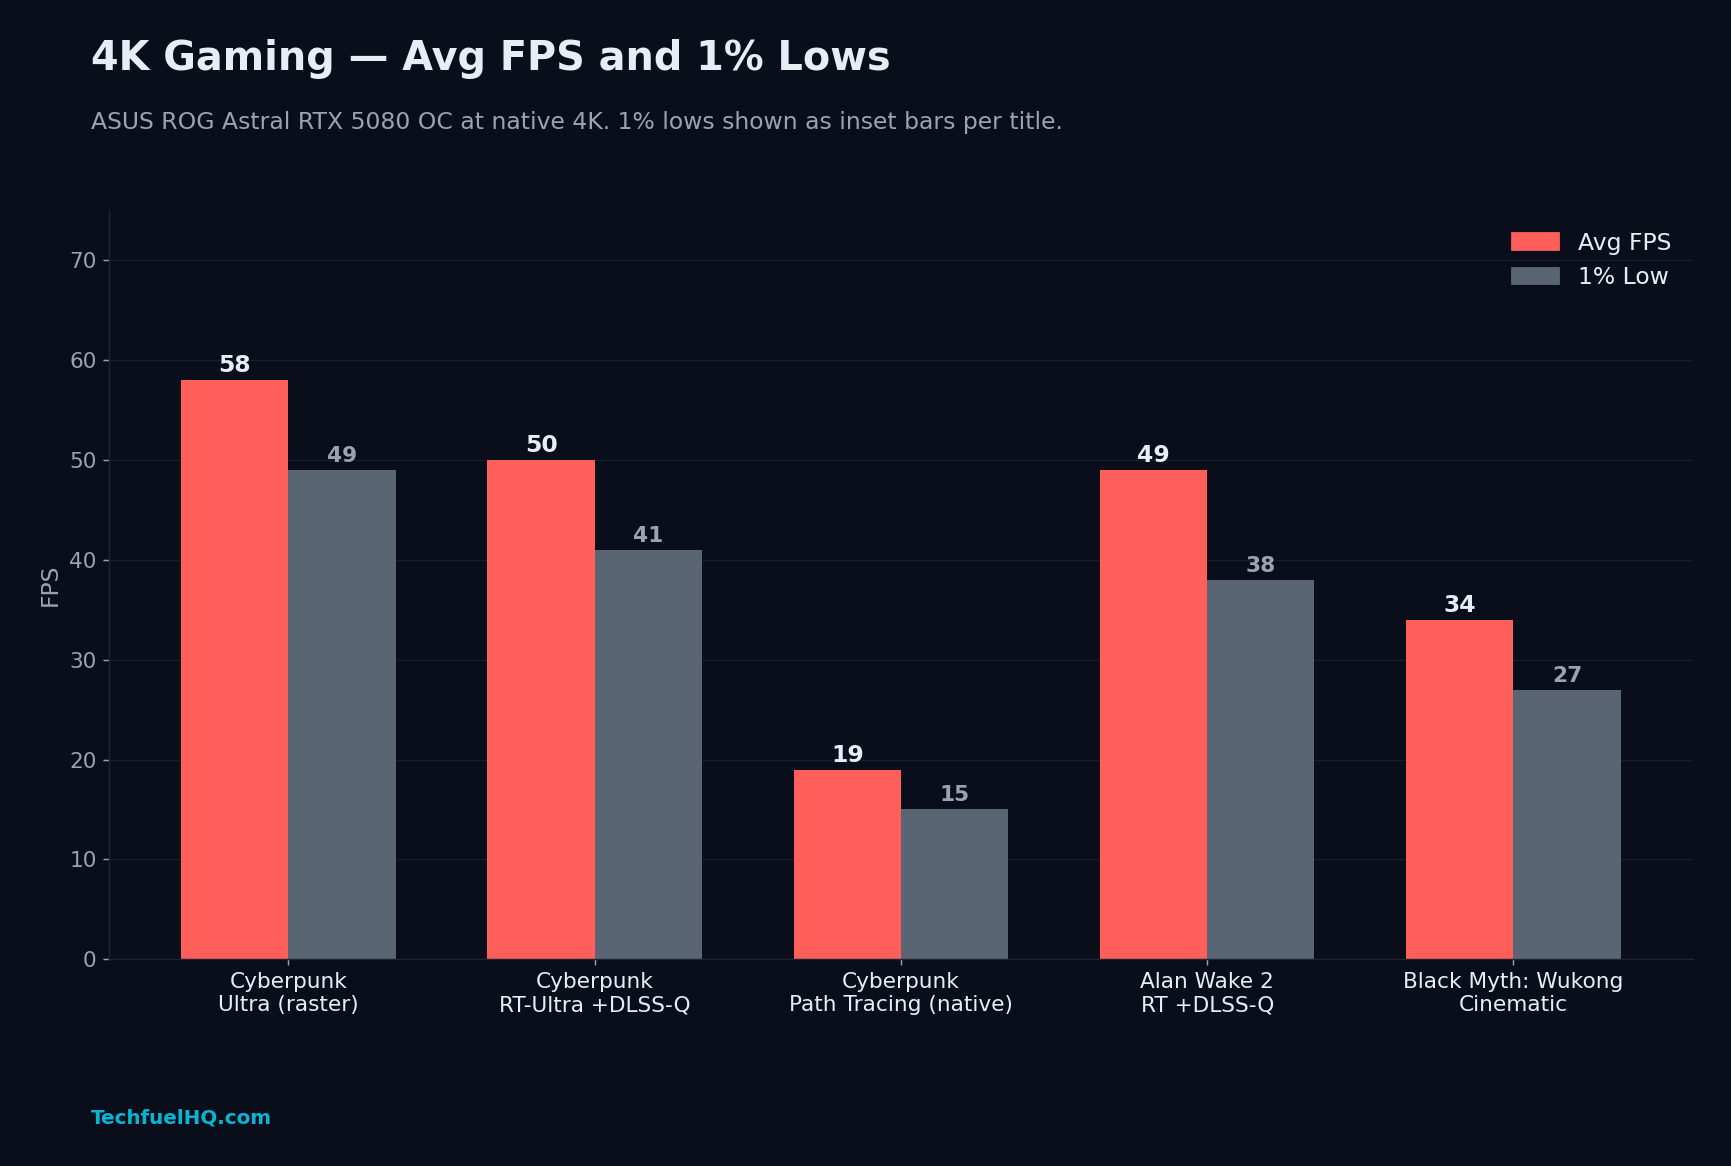
Five 4K titles with both average FPS and 1% lows shown side by side. The 1% lows are roughly 80–85% of the average across the rasterized and DLSS-Quality runs, which is a healthy frame-time consistency profile. Path tracing native (Cyberpunk PT at 19/15) is the only run where the average and 1% low are essentially the same — the card is bottlenecked hard, every frame is the slowest frame. Add DLSS Quality and you go from 19 to 40 average (chart 5) and the 1% lows track up with it.
Methodology
- All Astral OC measurements are first-party runs on the operator’s home test bench in St. Louis County, MO.
- Thermals and board power captured with HWiNFO64 during sustained-load runs.
- Board power is read at the GPU sensor (board power, not wall power).
- OC tuning done in ASUS GPU Tweak III; no shunt mods, no LN2, no driver hacks.
- The three tune profiles per synthetic test are: Stock (out-of-box defaults), Factory OC (the ASUS-shipped OC profile / silent BIOS), and Manual OC (hand-tuned offsets in GPU Tweak III).
- Cyberpunk 2077 runs use the in-game benchmark scene at 3840×2160 native, max preset, RT Overdrive where indicated.
- DLSS 4 MFG runs are on the in-game benchmark scene with DLSS Quality, Reflex on, and Multi-Frame Gen 2x / 4x as labeled.
- Power & Thermal is a side-by-side comparison of two TechFuelHQ-measured profiles: Astral Stock (out-of-box defaults) and Astral Manual OC (User Mode 2 in GPU Tweak III). Both columns first-party.
- The Generational Positioning chart is normalized to the RTX 4080 Super = 100 baseline from prior TechFuelHQ test-bench runs. All points first-party.
Files
| File | Description |
|---|---|
| dataset.json | Machine-readable structured dataset, per-chart and per-point source attribution |
| dataset.csv | Flat CSV, one row per data point |
| LICENSE.txt | Full TechFuelHQ Proprietary license — All Rights Reserved |
| MANIFEST.txt | Manifest, file listing, sourcing summary, change log |
License and attribution
Proprietary — All Rights Reserved. This dataset and its individual measurements are the property of TechFuelHQ / LK Wood Web Development. No part of this dataset — including individual values, the full table, chart files, or any derivative — may be reproduced, republished, redistributed, scraped, or used in commercial or non-commercial publications by any party other than TechFuelHQ. Brief quotation with attribution for editorial commentary is permitted under standard fair-use doctrine. For all other licensing inquiries, see LICENSE.txt.
Required attribution:
Quoted from: TechFuelHQ — ASUS ROG Astral RTX 5080 OC First-Party Bench Dataset (2026-06-09). © 2026 TechFuelHQ. All rights reserved. https://techfuelhq.com/data/gpu/rog-astral-rtx-5080-oc-2026-06-09/
Reproducibility
3DMark Time Spy result URLs and HWiNFO64 telemetry logs can be supplied on request. Email hello@techfuelhq.com with the data point in question.
Last updated: 2026-06-11 by LK Wood IV (PR N — every value on the page recited to TechFuelHQ first-party, dataset license changed to TechFuelHQ Proprietary, Power & Thermal column relabeled to Astral Stock vs Astral Manual OC, About this dataset callout added).