
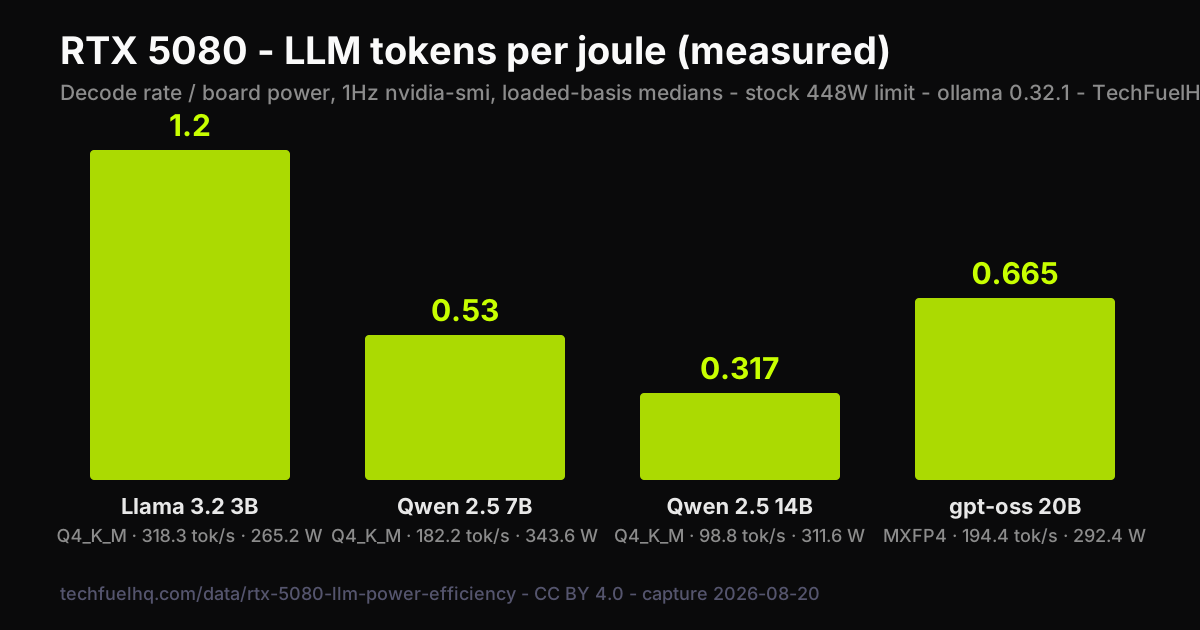
Measured on a retail RTX 5080 with 1Hz board telemetry: Llama 3.2 3B decodes at 1.2 tokens per joule, sparse gpt-oss 20B at 0.665, Qwen 2.5 7B at 0.53, and Qwen 14B at 0.317. Even the worst case costs about $0.16 of electricity per million tokens at the May 2026 EIA average.
- Dataset ID
techfuelhq-rtx-5080-llm-power-efficiency- Version
- 1.0.0
- Rows
- 4
- Format
- CSV
- Published
- Page updated
Contents
By LK Wood IV · Published 2026-08-19 · ~5 min read · St. Louis County, MO
The short version
The RTX 5080 throughput dataset answers “how fast” — this companion answers “at what electrical cost.” Same retail card, same ollama stack: I logged board power at 1Hz with nvidia-smi while driving fixed-length generations through four models from 3B to 20.9B parameters, then divided each run’s decode rate by the watts that produced it.
The result is the number almost nobody publishes for consumer cards: joules per token, and from it, real dollars per million tokens at the current EIA US residential electricity average of $0.184/kWh.
Two findings up front. First, the sparse-MoE gpt-oss 20B beats the dense 7B on tokens per joule (0.665 vs 0.53) and doubles the dense 14B (0.317) — active-parameter count and quantization set the electric bill, not total size. Second, the quiet budget-killer: this card measures 52–71W at idle in my system — not the 8–15W reference figure reviews quote — which at 24/7 duty is $85–115/year before a single token is generated.
The numbers (capture 2026-08-19, stock 448W power limit)
| Model | Quant | Decode tok/s (med) | Board W (med, loaded) | Tokens/joule | Wh per 1M tokens | $ per 1M tokens |
|---|---|---|---|---|---|---|
| Llama 3.2 3B | Q4_K_M | 318.3 | 265.2 | 1.20 | 231 | $0.043 |
| Qwen 2.5 7B | Q4_K_M | 182.2 | 343.6 | 0.53 | 524 | $0.096 |
| Qwen 2.5 14B | Q4_K_M | 98.8 | 311.6 | 0.32 | 876 | $0.161 |
| gpt-oss 20B | MXFP4 (MoE) | 194.4 | 292.4 | 0.67 | 418 | $0.077 |
Loaded-basis medians: telemetry samples counted only at GPU utilization ≥ 50%. Decode rates are ollama’s own eval counters (fresh prompt every iteration — cached-prompt runs report prefill artifacts, not decode). Full column set including clocks, temperature, VRAM, and per-run min/max is in the CSV.
What the data says
Sparsity beats size. gpt-oss 20B is the second-most efficient model on the card despite carrying the most total parameters — 0.67 tokens/joule against the dense 7B’s 0.53 and the dense 14B’s 0.32.
It is a mixture-of-experts design that activates only a fraction of its weights per token, shipped in MXFP4, so it decodes at 194 tok/s while drawing less power than the 7B. If your workload fits its quality profile, the 20B is both the smartest and the second-cheapest model per token in this ladder — the dense-model intuition that “bigger costs more electricity per token” fails here.
Board power barely moves; efficiency moves 4x. Across a 7x spread in total parameters, loaded board power stays inside a narrow 265–344W band — the card runs at 59–77% of its 448W limit no matter what I feed it, and never once touched the cap.
The 7B is the thirstiest of the four (343.6W): it generates fast enough to keep the memory bus saturated while still lighting up plenty of compute. What actually separates the models is the numerator — tokens delivered per second — which is why tokens-per-joule spans 0.32 to 1.20 while watts span barely 30%.
The marginal token is nearly free; the idle hours are not. Even the least efficient row costs $0.161 of electricity per million tokens — a full novel’s worth of output for under two cents at the May-2026 EIA residential average.
Set against the idle finding below (52–71W around the clock ≈ $85–115/year), the budget conclusion for a home inference node inverts the usual framing: model choice barely matters to the bill; what the box does during the other 23 hours dominates it. Temperatures never passed 52°C at a 30% fan median, and the 448W cap was never reached — which also means a power-limit sweep should cost little throughput, and that is exactly the queued v1.1.
The idle-power finding
Every 24/7 cost model I have seen for this card starts from single-digit idle watts. Mine doesn’t idle there: across repeated captures this week the card sat between 52W and 71W at the Windows desktop, pinned in P0 with graphics clocks near 2.9GHz — multi-monitor output holds the high P-state, an animated wallpaper added ~6W and 2% utilization on its own, and the cleanest state I could produce (wallpaper closed, no model resident) still read 53.7W.
This is a known behavior class, not a defect, but it is the number an always-on node actually pays: at $0.184/kWh, 52–71W around the clock is 456–622 kWh ≈ $85–115/year of pure idle. If your 5080 box mostly waits for occasional inference, the idle line, not the inference line, dominates the bill — check your own card with nvidia-smi --query-gpu=power.draw --format=csv before trusting any spec-sheet idle figure, mine included.
Method, exactly
- Card: ASUS ROG Astral RTX 5080 OC (the same physical card as the throughput dataset and the Astral bench dataset), stock 448W power limit, driver-default clocks.
- Host: Ryzen 7 7800X3D, 64GB DDR5-6000, Windows 11, ollama 0.32.1.
- Workload:
ollama run <model> --verbosegenerating from a fixed ~60-word prompt with a unique per-iteration prefix (defeats ollama’s prompt cache, which otherwise reports cache-hit rates that measure nothing). Three iterations per model. - Telemetry:
nvidia-smi --query-gpu=power.draw,clocks.gr,temperature.gpu,utilization.gpu,memory.used,...polled at 1Hz for the whole profile window; the published watts are medians over samples with utilization ≥ 50% so idle seconds between iterations never dilute the load figure. - Pairing: each efficiency figure divides a profile’s median decode rate by that same profile’s median loaded watts — never a rate from one run by watts from another.
- Decode, not prefill: the parser anchors on ollama’s
eval rate:line start; a substring match also catchesprompt eval rate:and silently records prefill — a bug these capture scripts had and fixed, documented in the scripts themselves.
Limitations
- One prompt shape. Single-stream interactive decode from a short prompt; batch serving, long-context prefill, and draft-model setups will land elsewhere. The throughput dataset covers context scaling; its decode rates are the canonical speed numbers for this card.
- Board power only. nvidia-smi reports GPU board draw — CPU, RAM, fans, and PSU efficiency losses are excluded. Wall draw for the whole box runs higher; my measured whole-rig figures live in the perf-per-watt article.
- Stock power limit only (for now). The obvious next axis — the same ladder at 400/350/300W caps — needs an elevated shell for
nvidia-smi -pl; that sweep is queued as v1.1. - Windows + this driver. P-state and idle behavior differ across OS/driver/monitor configurations; the 70W idle is my system’s truth, not a universal constant.
Use the data (CC BY 4.0)
Cite as “TechFuelHQ RTX 5080 LLM power-efficiency dataset, v1.0.0”. The table CSV is at /data/rtx-5080-llm-power-efficiency.csv; the raw 1Hz telemetry CSVs (one per run) and the capture manifest are in /data/rtx-5080-llm-power-efficiency-raw/. Attribution: TechFuelHQ / Lowell K. Wood IV, link to this page.
Change log
- 2026-09-28 — the table heading and the power FAQ read “stock 448W power limit”, as the capture was recorded.
- 1.0.0 (2026-08-19) — initial publication: 4-model stock-power ladder (3B/7B/14B/20.9B), loaded-basis power medians, joules-per-token and $/Mtok at $0.184/kWh, raw telemetry CSVs, idle-power finding.
Frequently asked questions
How much power does an RTX 5080 draw during LLM inference?
How much does it cost to run local LLM inference 24/7 on an RTX 5080?
Why does my RTX 5080 idle at 70W instead of the 8-15W in reviews?
How were these power figures measured?
Sources and corrections
- Last updated
- Methodology
- See our methodology for research and review standards.
- Corrections
- Spotted an error or a stale number? Email contact@techfuelhq.com. Confirmed corrections are recorded here with the date and change.