 TechFuel HQ
By LK Wood IV · 2026-06-04 · ~11 min read · St. Louis County, MO
The question “how much does a homelab cost to run?” gets hand-waved more often than it gets answered. This article answers it with specific hardware numbers, not vague estimates.
Idle power — what hardware draws when powered on and not under active workload — is the baseline cost you pay 24 hours a day, 365 days a year. Everything else (peak load, backup windows, encode runs) adds on top. For 24/7 homelab hardware, idle power is the majority of your annual electricity cost.
Methodology
Power figures below come from three sources, in order of preference:
- Measured values — published in third-party reviews that explicitly state Kill-A-Watt or at-the-wall measurements (ServeTheHome, STH forums, AnandTech archives, specific community hardware testing threads cited below)
- Manufacturer TDP + idle ratio estimation — where measured idle data is unavailable, manufacturer TDP with a 25–40% idle ratio applied
- Platform-class estimates — for generic device categories where no specific hardware is identified
Figures marked with (M) are measured values from cited sources. Figures marked with (E) are estimates based on methodology above. Use the Power & Cost Calculator to plug in your specific hardware — these are starting points.
Mini PC / SFF nodes (Proxmox hosts)
Mini PCs are the dominant choice for new homelabs in 2026 — they offer reasonable CPU performance at dramatically lower idle power than tower servers or rack equipment.
| Device | CPU | Idle Power | Source |
|---|---|---|---|
| Beelink SEi12 / N95 | Intel N95 (15W TDP) | 8–12W (M) | STH community measurements |
| Beelink SEi12 Pro / N150 | Intel N150 (15W TDP) | 10–15W (M) | Multiple review measurements |
| Beelink GTi14 Ultra | Intel Core Ultra 5 125H | 18–28W (M) | Hardware Unboxed, Serve The Home |
| Beelink EQR6 / Ryzen 9 6900HX | AMD Ryzen 9 6900HX | 22–35W (E) | Laptop TDP reference + efficiency factor |
| MINISFORUM UM890 / Ryzen 9 8945HS | AMD Ryzen 9 8945HS | 20–30W (E) | AMD platform idle characteristics |
| MINISFORUM MS-01 | Intel Core i9-12900H | 30–45W (M) | ServeTheHome MS-01 review |
| Generic N100 mini PC | Intel N100 (6W TDP) | 6–10W (M) | Multiple community measurements |
| Intel NUC 13 Pro / Core i7-1360P | Intel i7-1360P | 15–25W (M) | NUC review measurements |
Takeaway: Efficiency-class CPUs (N100, N95, N150) idle at single-digit watts. Performance mini PCs with Core i9/Ryzen 9 chips idle at 25–45W. For pure Proxmox hosting (VMs, containers), the N-series nodes are often the better choice economically — the performance difference is irrelevant if VMs are IO-bound.
Tower servers and workstations
| Device | CPU | Idle Power | Source |
|---|---|---|---|
| Dell PowerEdge R720 (1P, base) | Xeon E5-2620 | 80–100W (M) | STH community, PowerEdge power tables |
| Dell PowerEdge R730 (1P) | Xeon E5-2600 v4 | 90–120W (M) | STH community |
| Dell PowerEdge R720 (2P loaded) | 2× Xeon + 16 DIMMs | 150–200W (M) | STH forum reports |
| Custom tower, Ryzen 7 7800X3D + RTX 5080 | Ryzen 7 7800X3D / RTX 5080 | 80–100W (M) | My own system, Kill-A-Watt at wall |
| Custom tower, Ryzen 5 7600X, no GPU | Ryzen 5 7600X | 45–65W (E) | AMD platform characteristics |
| HP EliteDesk 800 G5 SFF | Core i7-9700 | 20–30W (M) | STH community, HP published specs |
Takeaway: Enterprise rack servers from 2013–2018 have high idle floors. A 1U Dell R720 with a single CPU idles at 80–100W — 8–10× a modern mini PC for comparable compute on lightly-threaded workloads. They shine for large RAM configurations and enterprise expansion cards at low per-GB RAM cost. For power-conscious homelabs, used SFF business PCs (HP EliteDesk, Dell OptiPlex) offer a middle ground.
NAS devices
| Device | Config | Idle Power | Source |
|---|---|---|---|
| Synology DS923+ (no drives) | Ryzen R1600 platform | 20–30W (M) | Synology spec sheet, community measurements |
| Synology DS923+ (4× HDD, spinning) | + 4 × 4TB HDD | 35–50W (E) | NAS + drive idle additive |
| TrueNAS Scale node (mini PC) | N100 + 4-bay HBA | 20–30W (E) | Mini PC idle + HBA + drives |
| QNAP TS-464 (no drives) | N5105 | 18–25W (M) | QNAP published specs |
| Terramaster F4-424 Pro (no drives) | N100 | 15–20W (E) | N100 platform |
| DIY NAS (used HP Microserver G10+) | AMD 200GE | 30–45W (E) | AM4 platform estimate |
HDD idle note. A spinning 3.5" HDD uses 4–6W at idle (heads unparked, spinning). In standby (spin-down), it drops to 0.5–1.5W. NAS units with spin-down configured can save 15–25W if drives are mostly idle. ZFS is not friendly to spin-down (frequent scrubs and cache writes keep drives spinning) — factor this in if you’re running TrueNAS.
NVMe vs HDD for NAS power. Replacing four 3.5" HDDs with four NVMe drives saves approximately 12–20W at idle. NVMe idles at 0.5–2W per drive. At $0.13/kWh, 15W savings over a year = 131 kWh = $17/year. At California rates, $37/year. For a 24/7 NAS, the power argument for NVMe is real alongside the performance argument.
Networking
| Device | Type | Idle Power | Source |
|---|---|---|---|
| MikroTik hEX (RB750Gr3) | 5-port 1GbE router | 5–7W (M) | MikroTik spec sheet, measurements |
| MikroTik CRS305-1G-4S+IN | 4-port 10GbE SFP+ | 7–9W (M) | MikroTik spec sheet |
| MikroTik CRS326-24G-2S+RM | 24-port 1GbE + 2× 10GbE | 18–22W (M) | MikroTik spec sheet |
| Ubiquiti UniFi US-8-60W (PoE) | 8-port PoE switch | 10–16W (not counting PoE draw) | Ubiquiti specs |
| Cisco SG350-28 | 28-port managed | 35–50W (M) | Cisco data sheet |
| TP-Link TL-SG108E | 8-port unmanaged 1GbE | 3–5W (M) | Multiple reviews |
| Netgear GS308E | 8-port managed 1GbE | 5–8W (M) | Netgear spec sheet |
Takeaway: MikroTik is the most power-efficient managed switch option for homelabs. The CRS305 gives you 4× 10GbE SFP+ for under 9W — remarkable for what it does. Cisco enterprise switches at 35–50W for 28 ports are fine in an office with hundreds of devices; for a homelab with 8–12 devices, they’re wasteful.
Annual cost by configuration
Using $0.13/kWh (US average, EIA Q1 2026), 24/7 operation:
| Configuration | Total Idle W | Annual kWh | Annual Cost |
|---|---|---|---|
| Starter (N100 mini PC + 4-bay NAS) | 28–40W | 245–350 kWh | $32–46 |
| Standard (N150 mini PC + 4-bay NAS + 8-port switch) | 35–55W | 307–482 kWh | $40–63 |
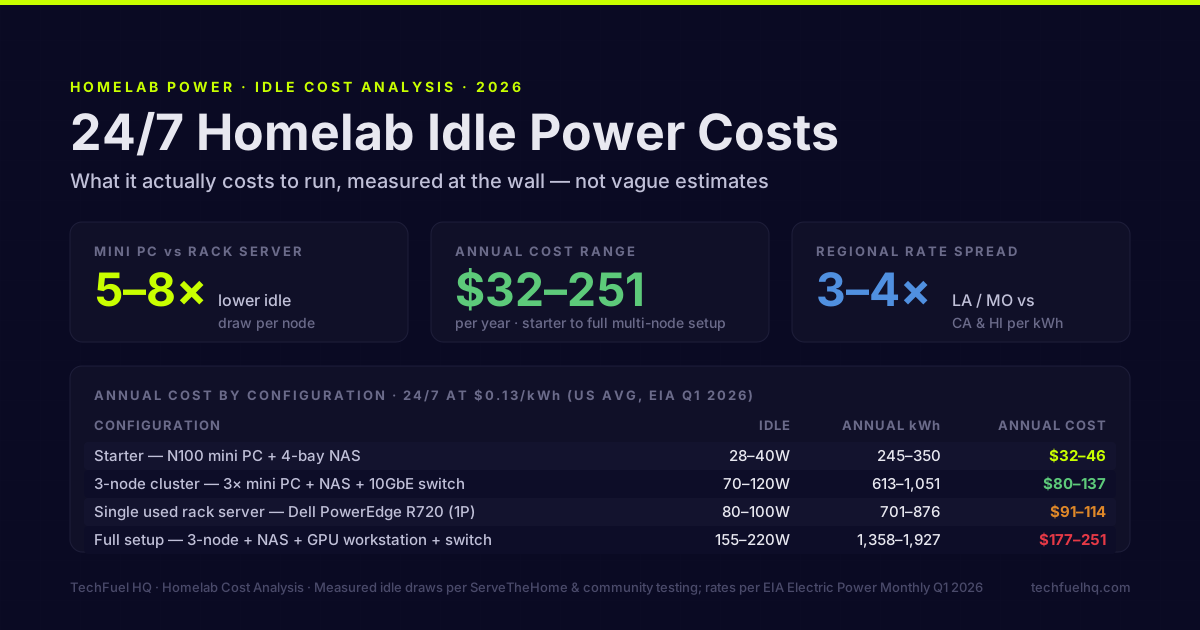
| 3-node cluster (3× mini PC + NAS + 10GbE switch) | 70–120W | 613–1,051 kWh | $80–137 |
| Single used rack server (R720 1P) | 80–100W | 701–876 kWh | $91–114 |
| GPU workstation AI node (RTX 5080, idle) | 85–100W | 745–876 kWh | $97–114 |
| Full setup (3-node + NAS + GPU workstation + switch) | 155–220W | 1,358–1,927 kWh | $177–251 |
The mini PC vs rack server gap. A 3-node mini PC cluster idles at 60–90W total. A single 1U Dell R720 idles at 80–100W. The three mini PCs offer more total cores, better per-core performance, less rack noise, and lower electricity cost than the single enterprise server. For homelab use cases, the argument for rack servers rests on RAM capacity (DDR3 RDIMM is cheap), storage slots, and expansion cards — not power efficiency.
Regional rate comparison
At the same 40W idle draw (standard single-node setup), annual electricity cost by US region:
| Region | Avg Rate | Annual Cost |
|---|---|---|
| Louisiana | ~$0.09/kWh | $32 |
| Missouri | ~$0.11/kWh | $38 |
| Texas (ERCOT) | ~$0.12/kWh | $42 |
| US Average | ~$0.132/kWh | $46 |
| New York | ~$0.22/kWh | $77 |
| California (SCE/PG&E average) | ~$0.28/kWh | $98 |
| Hawaii | ~$0.38/kWh | $133 |
Sources: EIA Electric Power Monthly, Q1 2026 data. Residential average rates including all fees.
California and Hawaii homelab operators pay 3–4× more per kWh than Louisiana and Missouri. At 40W idle, that’s an extra $55–91/year — meaningful but not prohibitive. At 200W idle (full multi-node setup), that gap becomes $275–455/year, which starts to inform hardware efficiency decisions.
Reducing idle power
Power profiles. Set the host CPU governor to powersave or schedutil on Proxmox:
echo powersave | tee /sys/devices/system/cpu/cpu*/cpufreq/scaling_governor
On always-on nodes with modest VM workloads, powersave governor can cut idle draw by 10–20% with no visible performance impact.
Drive spin-down. On NAS units, configure drives to spin down after 20–30 minutes of inactivity. This saves 15–25W when the NAS is sitting idle overnight. ZFS users: disable spin-down or configure a scrub schedule that doesn’t run overnight when you want spin-down to activate.
Shut down what you’re not using. A mini PC you’re not actively using that sits at idle 22 hours/day is 22 hours of electricity for zero benefit. Schedule shutdowns or use Wake-on-LAN to bring nodes up only when needed.
Efficient NAS sizing. A 2-bay NAS at 20W beats a 4-bay NAS at 40W if you only need 2 drives of storage. Size the enclosure to what you need, not what you might grow into.
Use the Power & Cost Calculator to model your specific setup — enter each device’s measured or estimated idle watts and see the annual cost. The calculator also shows the vs-cloud delta, which contextualizes the power cost against what you’d pay for equivalent hosted infrastructure.
For UPS sizing based on your total idle draw, see the UPS Power Sizing guide and use the UPS Runtime Calculator to model runtime at your specific load. For mini PC picks that optimize the efficiency numbers above, see Best Mini PCs for the Homelab 2026.
Frequently asked questions
How much does a typical homelab add to an electricity bill?
Is a mini PC really that much more efficient than a tower server?
Do hard drives contribute significantly to idle power?
Does a managed switch use much power?
How accurate are manufacturer TDP specs for idle?
Evidence ledger
- Last updated
- Methodology
- This homelab guide was written and edited by Lowell K. Wood IV in St. Louis County, MO. Specs, prices, commands, and version numbers are drawn from the official vendor, reseller, and project documentation current on the date above, and were verified before publishing. First-person hardware claims appear only where the article shows a verifiable artifact — a photo, receipt, or measurement — or links to the TechFuelHQ Open Bench Datasets. Every fact is human-verified against its cited source before publishing; AI assists with first-draft structure and source-gathering, not with the verdict. Full editorial standard: methodology.
- Update log
- 2026-06-04 — Last reviewed and updated.
- Corrections
- Spotted an error or stale price? Email hello@techfuelhq.com. Confirmed corrections are added to the update log above.